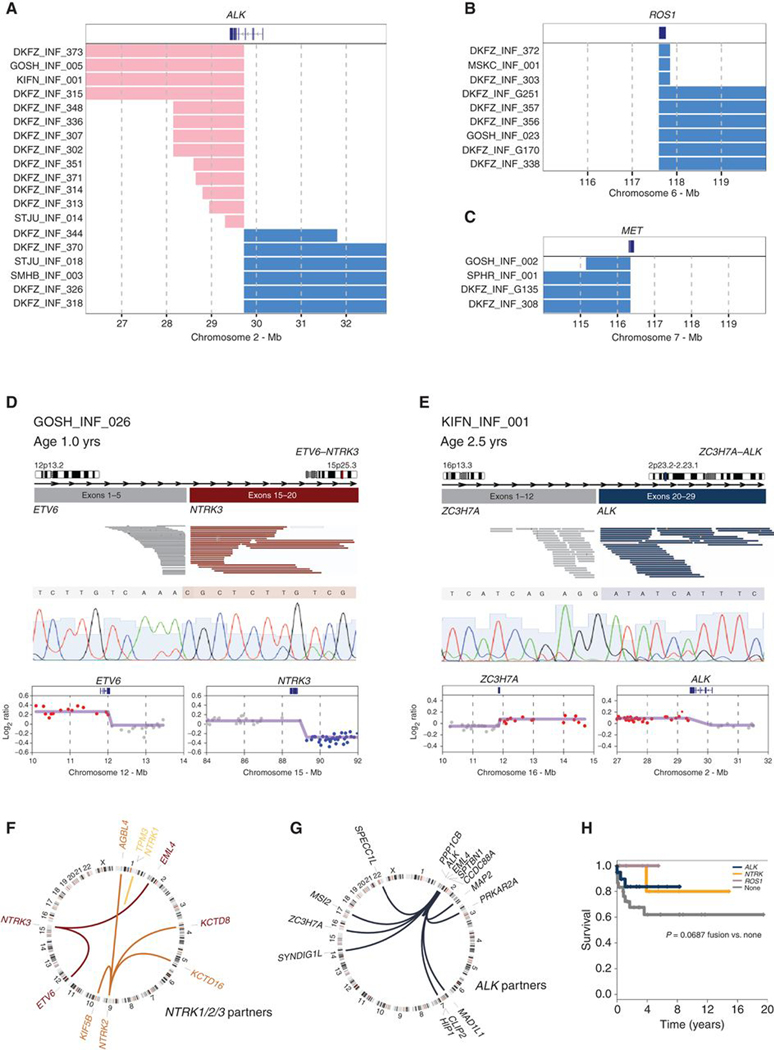
Figure 3.
Copy number–associated fusion genes in infant gliomas. A, Segmented DNA copy-number heat map for ALK breakpoint cases, plotted according to chromosomal location. Pink, gain; blue, loss. B, Segmented DNA copy-number heat map for ROS1 breakpoint cases, plotted according to chromosomal location. Pink, gain; blue, loss. C, Segmented DNA copy-number heat map for MET breakpoint cases, plotted according to chromosomal location. Pink, gain; blue, loss. D, ETV6–NTRK3. Cartoon representation of the fusion structure, with reads on either side of the breakpoint colored by gene partner and taken from an Integrated Genome Viewer snapshot. Below this is a Sanger sequencing trace spanning the breakpoint. Underneath are copy-number plots (log2 ratio, y-axis) for chromosomal regions spanning the breakpoints (x-axis). Points are colored red for copy-number gain, blue for loss, and grey for no change. The smoothed values are overlaid by the purple line. E, ZC3H7A–ALK. Cartoon representation of the fusion structure, with reads on either side of the breakpoint colored by gene partner and taken from an Integrated Genome Viewer snapshot. Below this is a Sanger sequencing trace spanning the breakpoint. Underneath are copy-number plots (log2 ratio, y-axis) for chromosomal regions spanning the breakpoints (x-axis). Points are colored red for copy-number gain, blue for loss, and gray for no change. The smoothed values are overlaid by the purple line. F, Circos plot of gene fusions targeting NTRK1 (light orange), NTRK2 (orange), and NTRK3 (dark orange). Lines link fusion gene partners according to chromosomal location, represented by ideograms arranged around the circle. G, Circos plot of gene fusions targeting ALK (dark blue). Lines link fusion gene partners according to chromosomal location, represented by ideograms arranged around the circle. H, Kaplan–Meier plot of overall survival of cases separated by fusion event (n = 63). P value is calculated by the log-rank test (P = 0.085 for any fusion vs. none).

