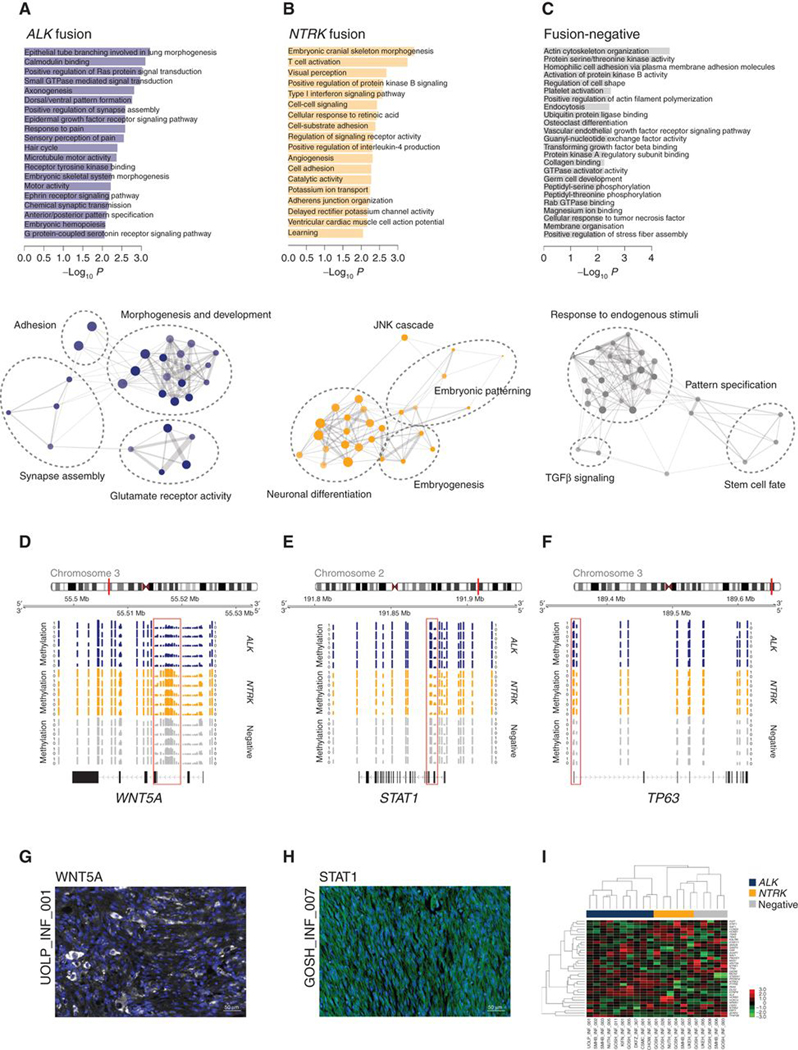
Figure 4.
Epigenetic alterations in fusion-positive and fusion-negative infant gliomas. A, Differential methylation-based gene ontology analysis for ALK-fusion cases, represented in bar plots of −log10 P value for labeled highest-scoring categories (top) and aggregated ontology networks (bottom). B, Differential methylation-based gene ontology analysis for NTRK-fusion cases, represented in bar plots of −log10 P value for labeled highest-scoring categories (top) and aggregated ontology networks (bottom). C, Differential methylation-based gene ontology analysis for fusion-negative cases, represented in bar plots of −log10 P value for labeled highest scoring categories (top) and aggregated ontology networks (bottom). Node size is proportional to the number of genes, shading represents −log10 P value (darker is higher). Thickness of connecting lines reflects the percentage of overlapping genes. D, Genome browser view of the WNT5A locus, with lower methylation, provided as bar plots, in selected ALK-fusion (blue) cases compared to NTRK-fusion (orange) and fusion-negative (gray) cases. E, Genome browser view of the STAT1 locus, with lower methylation, provided as bar plots, in selected NTRK-fusion (orange) cases compared with ALK-fusion (blue) and fusion-negative (gray) cases. F, Genome browser view of the TP63 locus, with lower methylation provided as bar plots, in selected fusion-negative (gray) cases compared with ALK-fusion (blue) and NTRK-fusion (orange) cases. Chromosomal ideograms are provided, with the red bar indicating the cytoband in which the locus is found. Differentially methylated probes are highlighted by the red box. G, Immunofluorescence staining of an antibody directed against WNT5A (white) in an EML4–ALK fusion infant glioma case, UOLP_INF_001. DAPI is used as a counterstain. Scale bar, 50 μm. H, Immunofluorescence staining of an antibody directed against STAT1 (green) in an ETV6–NTRK3 fusion infant glioma case, GOSH_INF_007. DAPI is used as a counterstain. Scale bar, 50 μm. I, Heat map representing gene expression values from a NanoString assay of 30 most differentially methylated genes between ALK-fusion (blue), NTRK-fusion (orange), and fusion-negative (gray) cases. Expression values are colored according to the scale provided.

