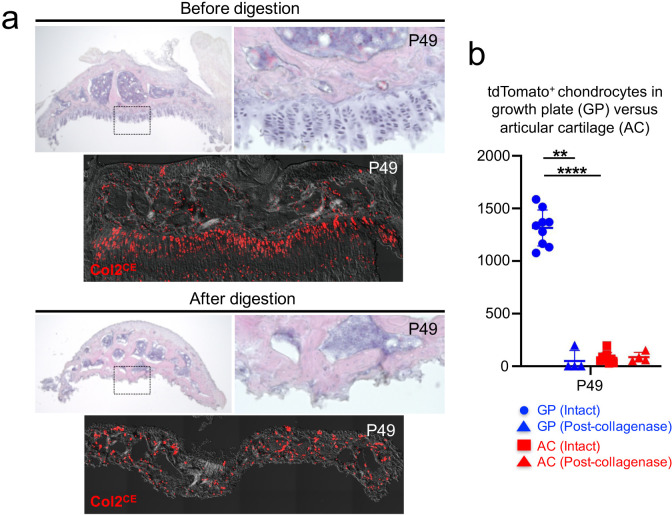
Figure 3. A protocol to preferentially isolate growth plate chondrocytes from postnatal epiphyses.
(a) Representative epiphyses of Col2a1-creER; R26R-tdTomato proximal tibia at P49, before (upper) and after (lower) serial collagenase digestions. (Top panels): H and E staining, (bottom panels): tdTomato epifluorescence. Red: tdTomato, gray: DIC. (b) Quantification of tdTomato+ chondrocytes in growth plate (GP) and articular cartilage (AC) before and after collagenase digestion. Blue: GP, red: AC. n=nine mice (Intact), n=four mice (Post-collagenase). **p<0.01, ****p<0.0001. Mann-Whitney’s U-test. Data are represented as mean ± s.d.

