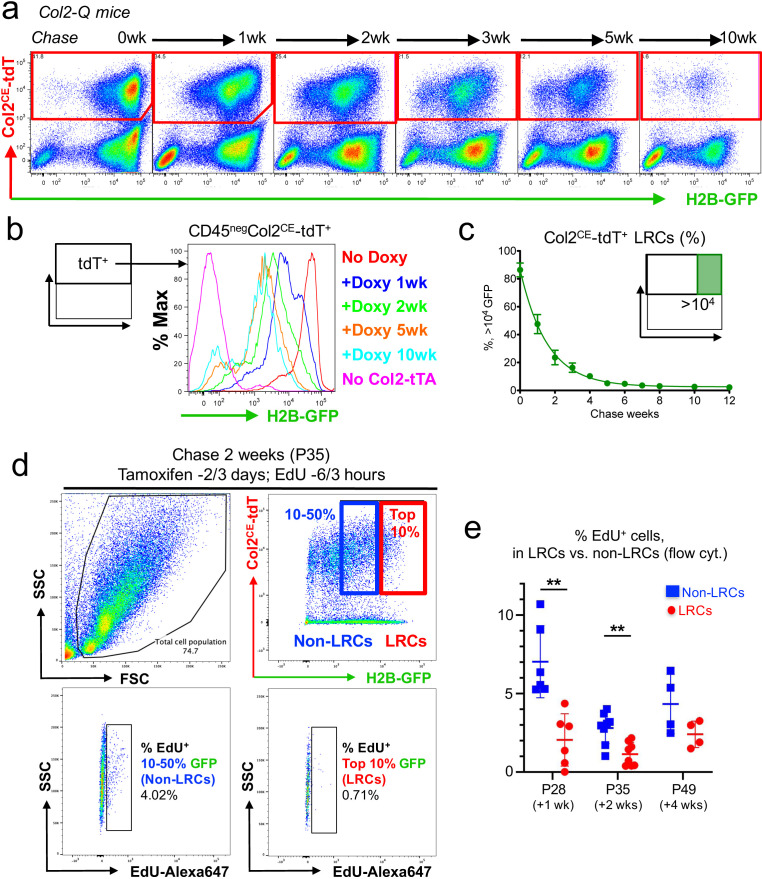
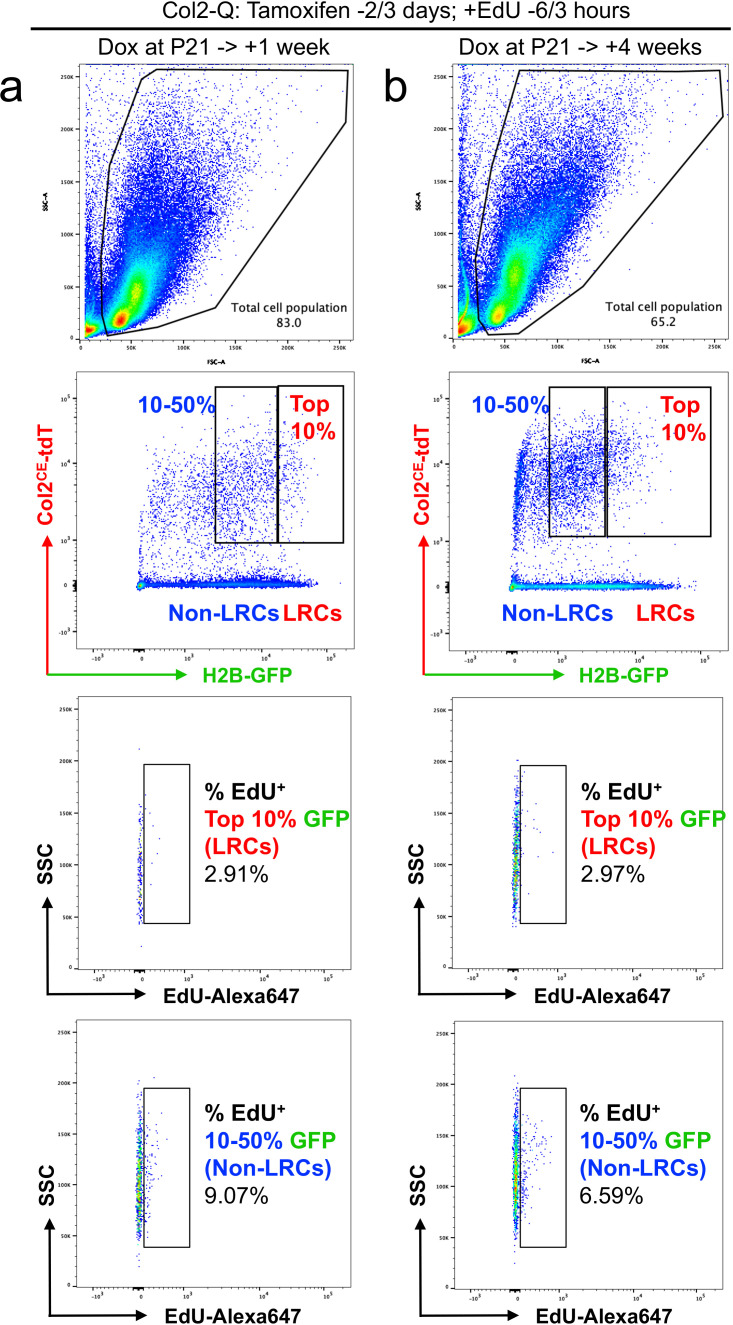
Figure 4. A flow cytometry-based identification and isolation of LRCs from Col2-Q mice.
(a–c) Flow cytometry analysis of dissociated Col2-Q growth plate cells. (a): Pseudo-color plots of CD45neg cells at the indicated number of weeks in chase. Red gates: Col2a1-creER/tdTomato+ (Col2CE-tdT+) cells. (b): Histogram of CD45negCol2CE-tdT+ cells showing the distribution of H2B-EGFP+ cells as the percentage of the maximum count. Red line: P21 (No Doxy), blue line: P28 (+Doxy 1wk), green line: P35 (+Doxy 2wk), orange line: P56 (+Doxy 5wk), light blue line: P91 (+Doxy 10wk), pink line: No Col2-tTA control at P21. (c): Percentage of >104 H2B-EGFP+ LRCs among total Col2CE-tdT+ cells. x axis: weeks in chase, y axis: % of cells > 104 unit of GFP. n=nine mice (0 week, 1 week), n=seven mice (2 weeks, 5 weeks), n=six mice (3 weeks, 4 weeks), n=five mice (6 weeks) and n=three mice (7 weeks, 8 weeks, 10 weeks, 12 weeks). Data are presented as mean ± s.d. (d) Flow cytometry analysis of cell proliferation in LRCs and Non-LRCs of Col2-Q growth plates at P35, with EdU administration shortly before analysis (6 and 3 hr prior to sacrifice). LRCs are defined as Col2CE-tdT+ cells with the top 10 percentile H2B-GFP brightness (red box), while Non-LRCs are defined as Col2CE-tdT+ cells with 10–50 percentile H2B-GFP brightness. Top left panel: forward/side scatter plot, top right panel: CD45-eFlour450neg fraction. Bottom panels: EdU-Alexa647 (x axis) signal of LRCs (right) and Non-LRCs (left). (e) Quantification of % EdU-Alexa647+ cells among LRCs and non-LRCs, harvested from Col2-Q growth plates at P28 (+1 week; n=six mice), P35 (+2 weeks; n=eight mice) and P49 (+4 weeks; n=four mice). **p<0.01. Mann-Whitney’s U-test. Data are represented as mean ± s.d.


