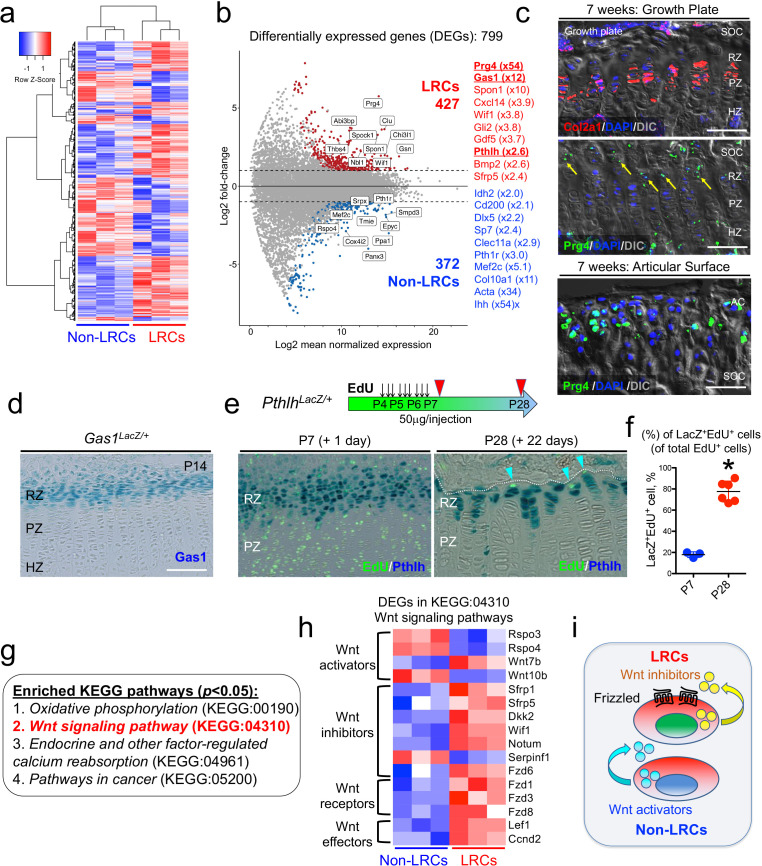
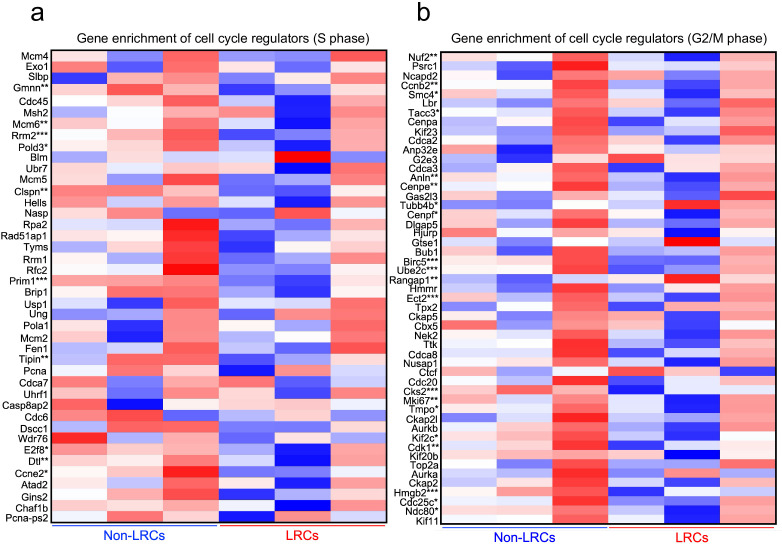
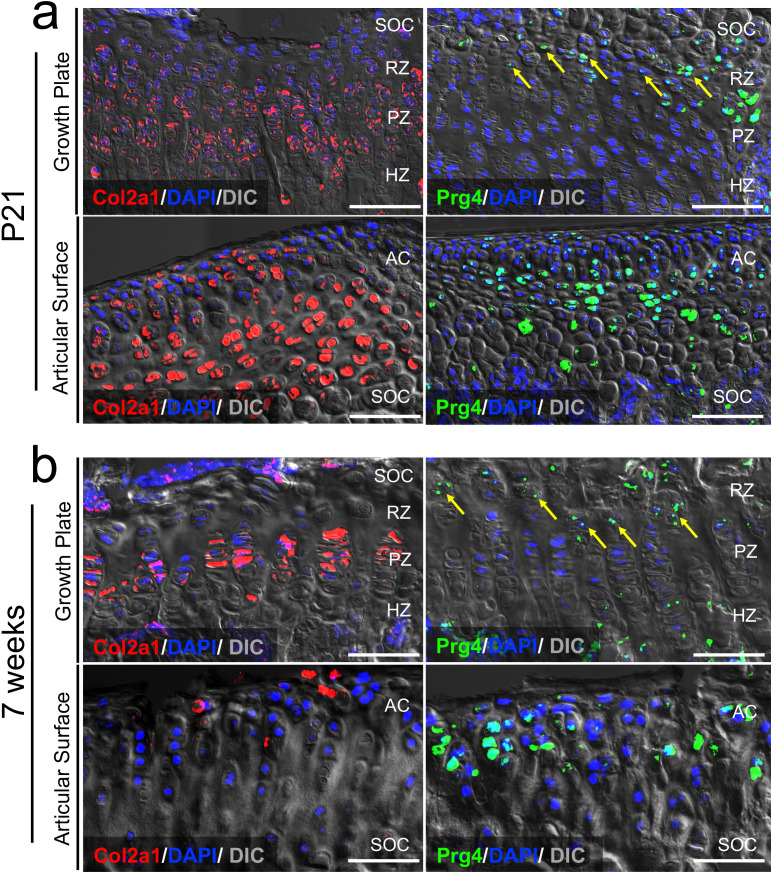
Figure 5. Unique molecular signature of label-retaining chondrocytes (LRCs) in the postnatal growth plate.
(a) Comparative RNA-seq analysis of LRCs and non-LRCs. Heatmap of top 500 differentially expressed genes (DEGs) with hierarchical clustering, between isolated non-LRCs and LRCs. (b) MA plot (Log2 fold change) of differentially expressed genes (DEGs) between isolated non-LRCs (372 total) and LRCs (427 total) with representative upregulated genes in each cell population. (c) Fluorescent RNAscope in situ hybridization analysis of Col2a1 and Prg4 mRNA in growth plate (top) and articular surface (bottom) at 7 weeks of age. SOC: secondary ossification center, RZ: resting zone, PZ: proliferating zone, HZ: hypertrophic zone. Blue: DAPI, red: Col2a1, green: Prg4, gray: DIC. Scale bar 100 µm. (d) Gas1LacZ/+ distal femur growth plates at P14. Scale bar: 100 µm. (e,f) PthlhLacZ/+ distal femur growth plates with EdU administration, serially pulsed nine times between P4 and P6. (e, left panel): Immediately after the pulse at P7. (e, right panel): After 22 days of chase at P28. Arrowheads: EdU label-retaining LacZ+ cells. RZ: resting zone, PZ: proliferating zone. Scale bars: 100 µm. (f): The percentage of LacZ+EdU+ cells among total EdU+ cells, at P7 (n=three mice) and P28 (n=six mice). *p<0.05, Mann-Whitney’s U-test. Data are represented as mean ± s.d. (g) Enriched KEGG pathway terms (p<0.05) based on 799 differentially expressed genes (DEGs). (h) Heatmap of differentially expressed genes (DEGs) related to KEGG:04310 (canonical Wnt/β-Catenin signaling pathway). The DEGs were further classified by their functions (e.g. Wnt activators, Wnt inhibitors, Wnt receptors and Wnt effectors). (i) Schematic diagram of Wnt activation and inhibition in non-LRCs and LRCs, respectively.


