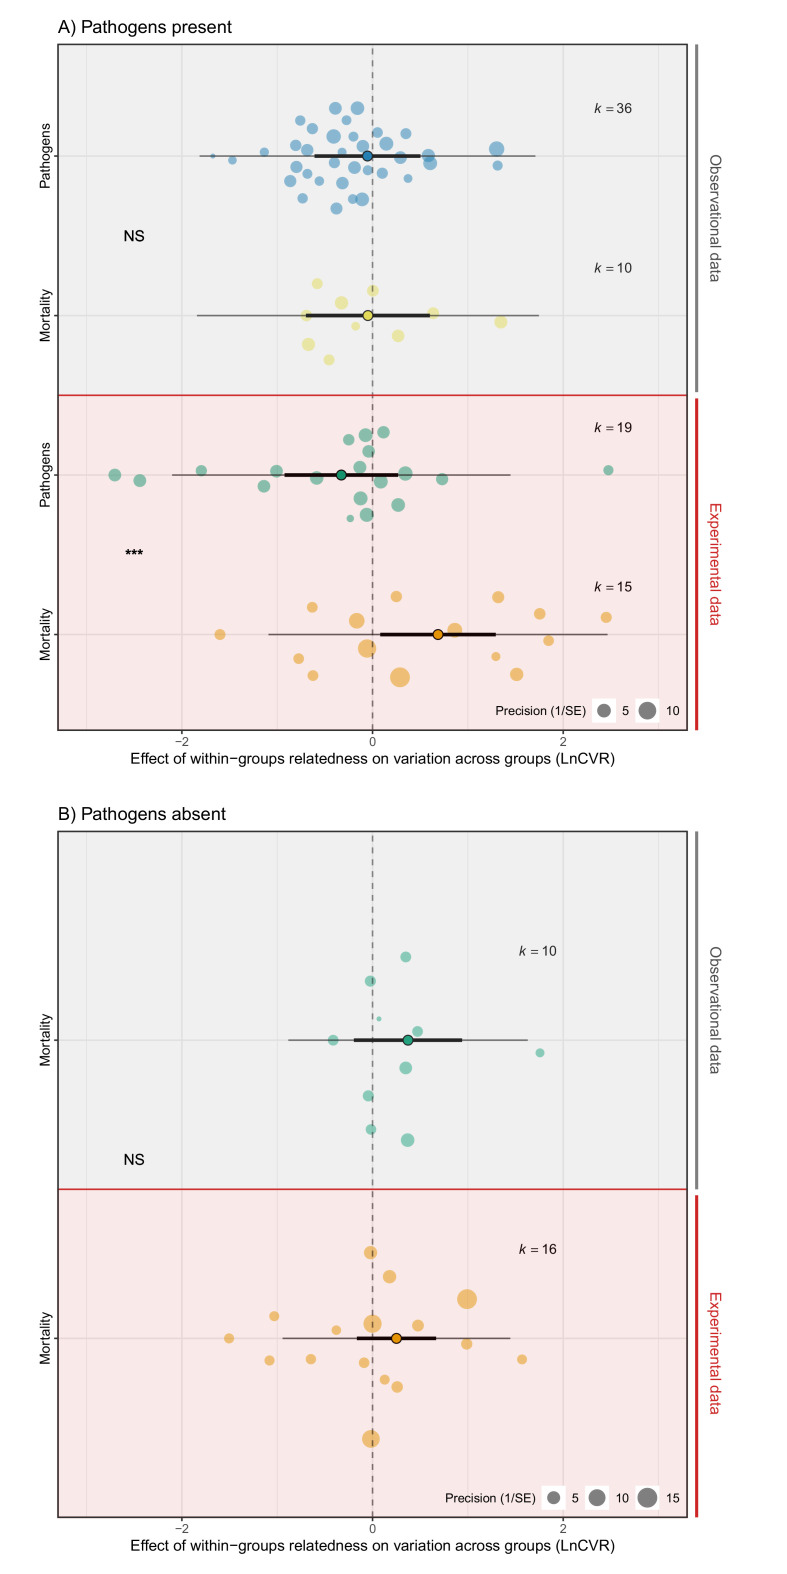
Figure 4. The effect of within-group relatedness on variance in mortality and pathogen abundance.
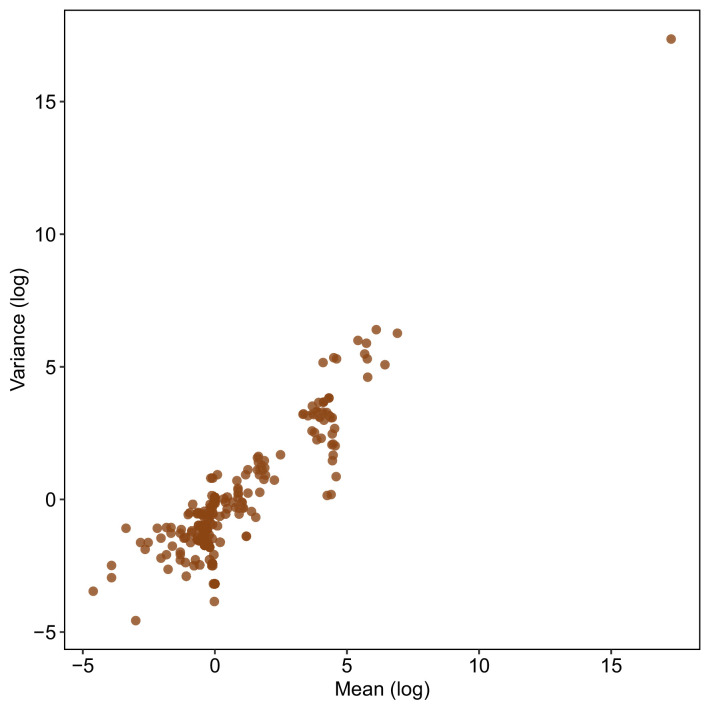
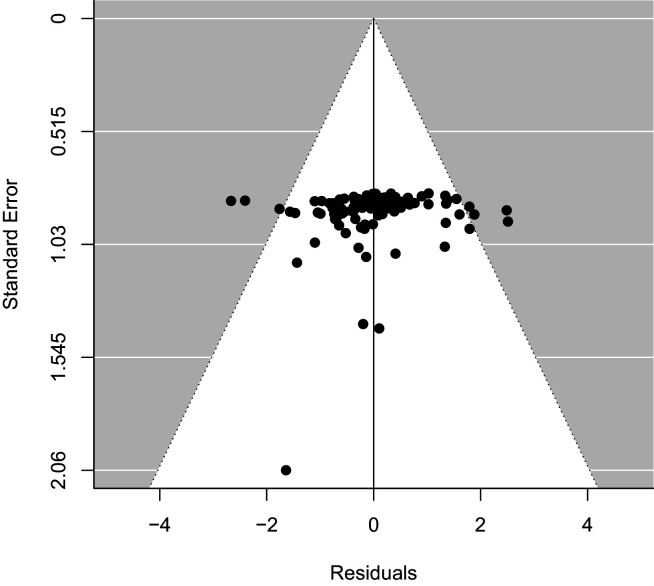
Positive effect sizes (LnCVR) show that variation in rates of mortality and/or pathogen abundances across groups (accounting for mean differences – see Figure 4—figure supplement 1 for mean variance relationship) increases with within-group relatedness, negative values show decreases in variance, and zero values show no change in variance (dotted line). (A) In the presence of pathogens, relatedness increased variance in mortality, but decreased variance in pathogen abundance. (B) When pathogens were absent, relatedness did not influence variance in mortality. The components of the orchard plots are the same as in Figure 2. Statistical differences are from Bayesian Phylogenetic Multi-level Meta-regressions (BPMMs) and placed mid-way between comparison groups denoted with symbols: NS = non-significant, *pMCMC < 0.05, ** pMCMC < 0.01, ***pMCMC < 0.001. Figure 4—figure supplement 2 for examination of publication bias.


