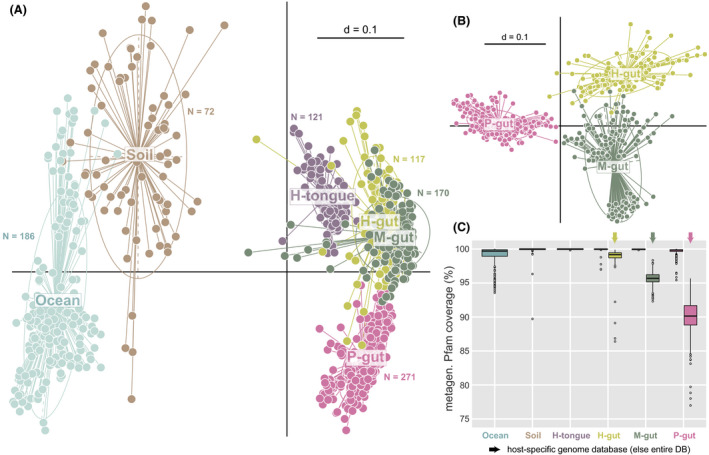
Fig. 2.

Input metagenomes from six different types of complex microbial communities.
A. Multi‐dimensional plot based on the presence/absence of Pfams (Jaccard index) in each individual metagenome (dots) from two environmental (marine water and soil) and four host‐associated metagenomes: the tongue and gut of humans (H) and the gut of mice (M) and pigs (P). The number of computed metagenomes per environment is indicated next to the corresponding cluster of samples. P < 0.01 as tested by permutational multivariate analysis of variance using distance matrices with the function adonis in R.
B. Same as in A showing further host species delineations between gut microbiomes.
C. Coverage of all metagenomes per habitat category (i.e. percentage of metagenomic Pfams also present in the reference MiMiC‐processed genomes) by the entire database (DB) or host‐specific collections of genomes for the human, mouse and pig intestine.
