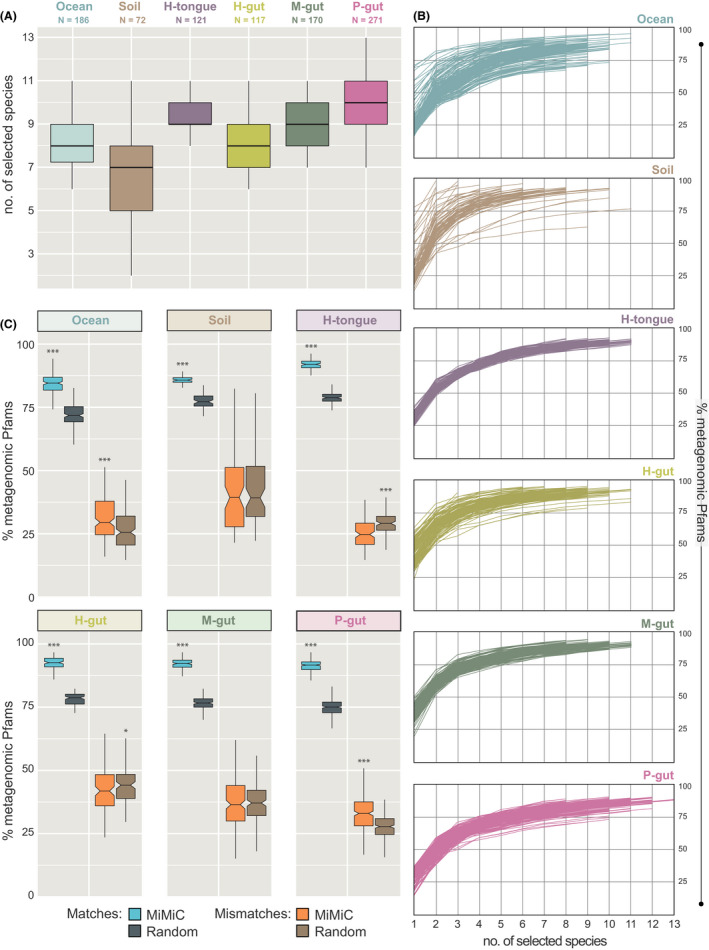
Fig. 3.

Output of MiMiC analysis on complex communities.
A. Distribution of the number of species per minimal consortium according to knee point‐based calculation after 50 iterations. The number of samples considered is indicated below the name of each community category.
B. Coverage of metagenomic profiles (y‐axis) according to incremental selection of genomes by MiMiC until sample‐specific knee points (x‐axis = rank of genome selection).
C. Performance (% of matches and mismatches) of MiMiC outputs compared with 100 sets of an equal number of species randomly selected from the entire database for each individual metagenome. P‐values were calculated using the Wilcoxon rank‐sum test; ***P < 0.001.
