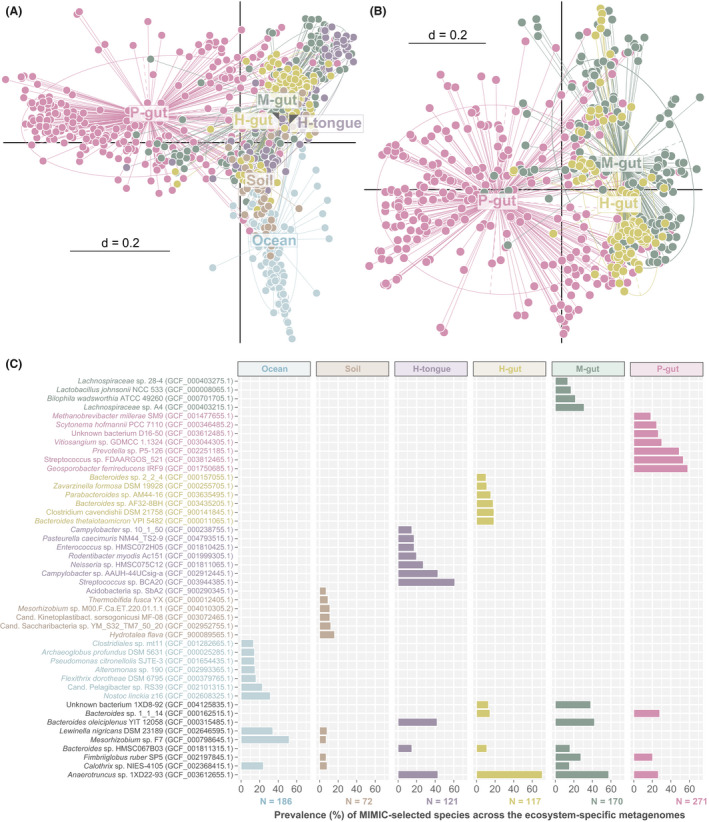
Fig. 4.

Ecosystem‐specific synthetic communities.
A. Multi‐dimensional plot based on the presence/absence of species (Jaccard index) selected by MiMiC within individual minimal consortia (dots), each corresponding to one input metagenome from six ecosystem types. The centroid of each type is indicated directly by the label or else by grey arrowheads within the label in case of overlaps. P < 0.01 as tested by permutational multivariate analysis of variance using distance matrices with the function adonis in R.
B. Same as in A showing further host species delineations between gut microbiomes.
C. Species identity (with sequence accession in brackets) of the 10 most prevalent genomes selected by MiMiC for each habitat type, prevalence being defined as the percentage of minimal microbial consortia containing the given species. The total number of metagenomes/minimal consortia considered per habitat category is shown below the x‐axis. Species identities are written in habitat‐specific colours if unique and in black if shared between habitats.
