Fig. 5.

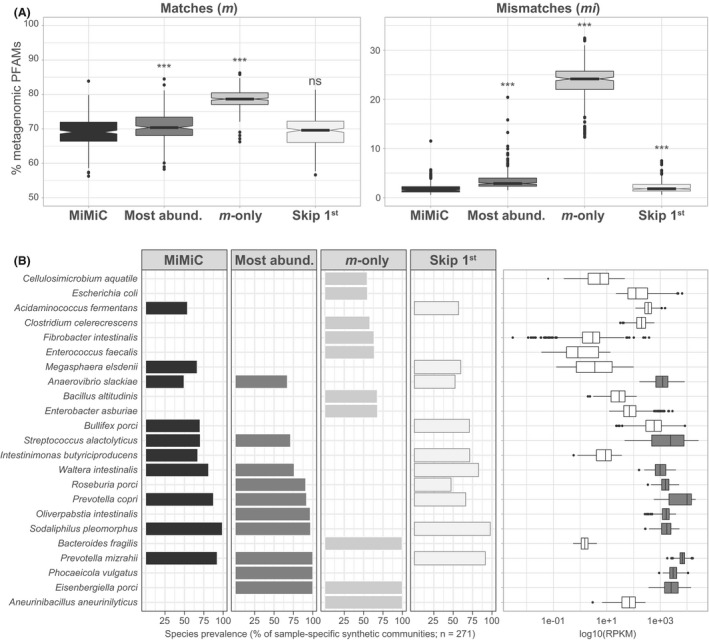
Comparison with alternative strategies for genome selection. Data were generated using the 271 pig metagenomes (Xiao et al., 2016) and genomes from the pig intestinal bacterial collection (Wylensek et al., 2020).
A. Fraction of matches (m) and mismatches (mi) within the synthetic communities as a percentage of metagenomic Pfams for each of the following four methods: (i) MiMiC (see detailed description in the methods; (ii) synthetic communities based on most abundant members (Most abund.), at a number of species equal to that selected by MiMiC (knee point method); (ii) calculated using only Pfam matches between any genome and the input metagenome, i.e. mismatches were not considered (m‐only); (iii) excluding the first selected genome (skip 1st).
B. List of species selected by the different methods. The 10 most prevalent species, i.e. most often selected by the given method across all input metagenomes, are shown. The bars indicate their respective prevalence (% of 271). The relative abundance of each species is shown as logarithmic values of RPKM (reads per kilo base per million mapped reads).
