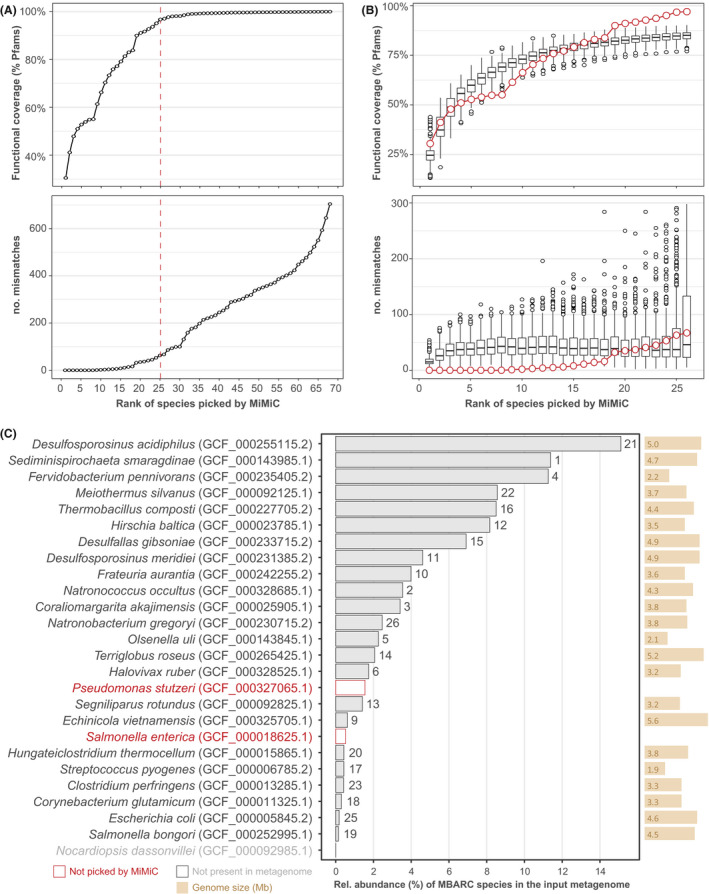
Fig. 6.

Mock community analyses.
A. Functional coverage and number of mismatches across the total iterations required to cover all Pfams from the input reference metagenome. The dashed red line represents the knee point determined on functional coverage.
B. MiMiC output (red dots) against 100 sets of randomly picked genomes until the number of 26 taxa.
C. Strain identification (with sequence accession in brackets) of the target species within the mock community sorted in decreasing relative abundance within the shotgun sequencing data (x‐axis, in %) as reported in the original paper (Singer et al., 2016). The rank (i.e. iteration) at which each species was selected by MiMiC is indicated on top of the bars.
