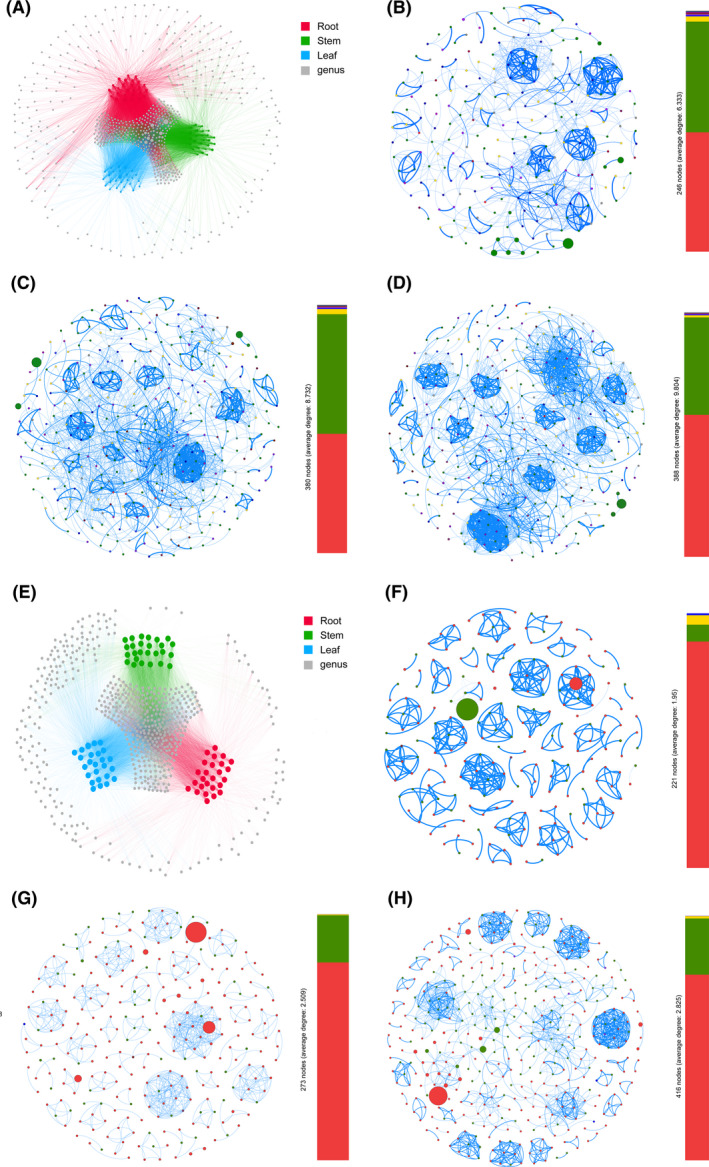
Fig. 3.

Network co‐occurrence analysis of microbial communities within plant compartments in P. notoginseng.
A. Bacterial genus.
B–D. Bacterial communities of root, stem and leaf respectively.
E. Fungal genus.
F–H. Fungal communities of root, stem and leaf respectively. A connection indicates a strong correlation (Spearman, |ρ| > 0.7, P < 0.01). Blue edges represent positive correlation, while red edges represent negative correlation. Each node represents taxa affiliated at genus level, and the size of node is proportional to the relative abundance of each genus. Each node is labelled at phylum level, the colour of nodes stand for different phylum.
