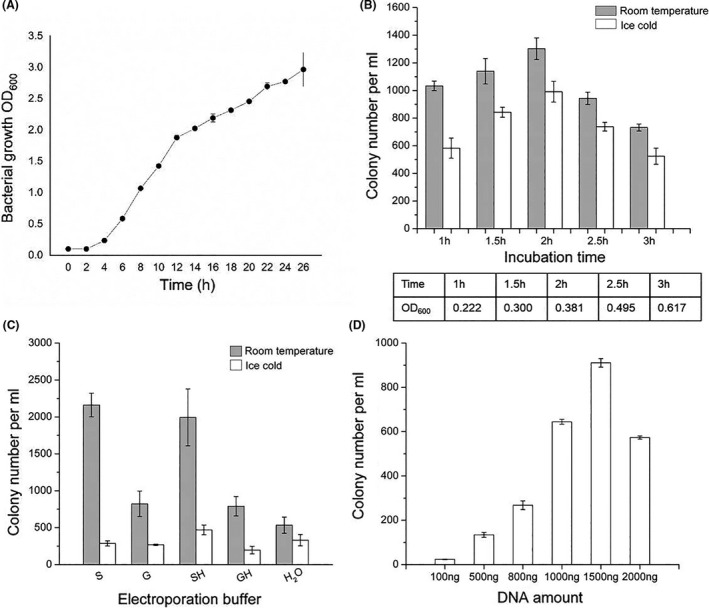
Fig. 2.

Optimization of transformation efficiency in B. glumae PG1. (A) Growth curve of B. glumae PG1. The optical density at 600 nm (OD600) was measured every 2 h from a starting OD600 of 0.1. (B–D) Transformation efficiency comparison in B. glumae PG1 using different (B) incubation times and temperatures, (C) electroporation solutions and (D) DNA amounts. For (C), the competent cells were treated with different electroporation solutions: H2O, double‐distilled water; S, 10% sucrose (w/v); G, 10% glycerol (v/v); SH, 10% sucrose (w/v) + 2 μM HEPES; GH, 10% glycerol (v/v) + 2 μm HEPES. Error bars, SD; n = 3.
