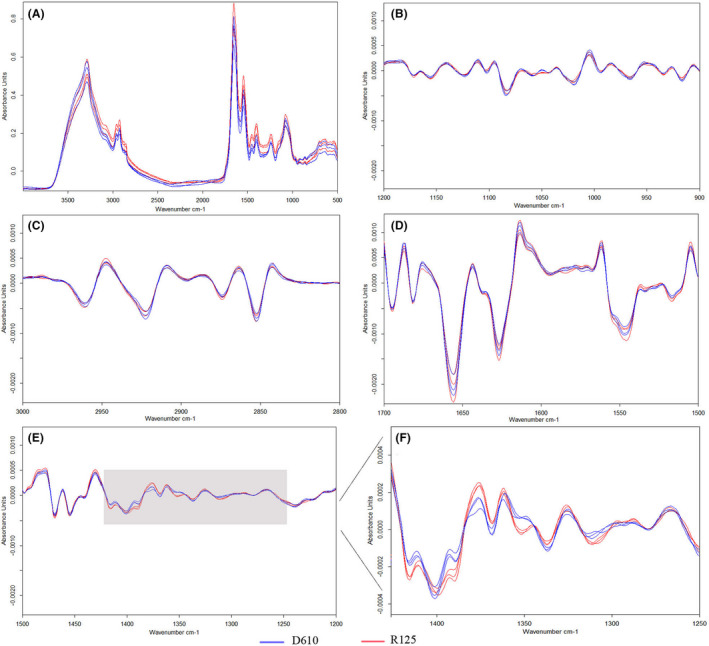
Fig. 1.

Second derivative FTIR spectra of four biochemical assigned sub‐ranges of D610 and R125 obtained from 24 h incubation time of MH agar plate.
A. Typical infrared spectra in the wavenumber 4000–500 cm−1 of three replicates of D610 (blue line) and R125 (red line); B. Second‐derivative FTIR spectra in the polysaccharide absorption region (1200–900 cm−1); C. Second‐derivative FTIR spectra in the lipids absorption region (3000–2800 cm−1); D. Second‐derivative FTIR spectra in the proteins/amides I and II (1700–1500 cm−1) regions;
E. Second‐derivative FTIR spectra in the mixed region of phospholipids/DNA/RNA (1500–1200 cm−1); F. The amplified phospholipids/DNA/RNA region (1425–1250 cm−1).
