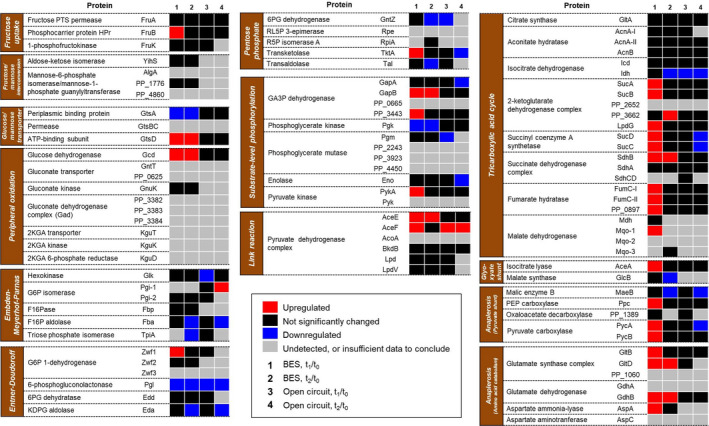
Fig. 3.

Proteome analysis of KT2440’s central carbon metabolism during BES cultivation in fructose. Differential expression analysis of the proteins involved in the central carbon metabolism pathway during KT2440’s BES (n = 3) and open‐circuit (n = 2) cultivation in fructose. 1, change of expression at peak current (t1) compared to at inoculation (t0) during BES cultivation; 2, change of expression 414 h after inoculation (t2) compared to at inoculation during BES cultivation; 3, change of expression at 146 h (t1) compared to at inoculation (t0) during open‐circuit cultivation; 4, change of expression 414 h after inoculation (t2) compared to at inoculation during open‐circuit cultivation. Abundance of individual protein is normalized to abundance of GapDH Mrsa252. Statistical analysis of protein abundance over the course of the experiment was conducted using one‐tailed paired t‐test. Data with ∣log2FC∣ > 1 and P‐value < 0.05 are considered to be significant. Red indicates upregulation, blue indicates downregulation, black indicates insignificant change, grey indicates FC not determined. 2KGA, 2‐ketogluconate; G6P, glucose 6‐phosphate; F16P, fructose 1,6‐bisphosphate; 6PG, 6‐phosphogluconate; KDPG, 2‐keto‐3‐deoxy‐6‐phosphogluconate; RL5P, ribulose 5‐phosphate; R5P, ribose 5‐phosphate; GA3P, glyceraldehyde 3‐phosphate; PEP, phosphoenolpyruvate; Aa, amino acid.
