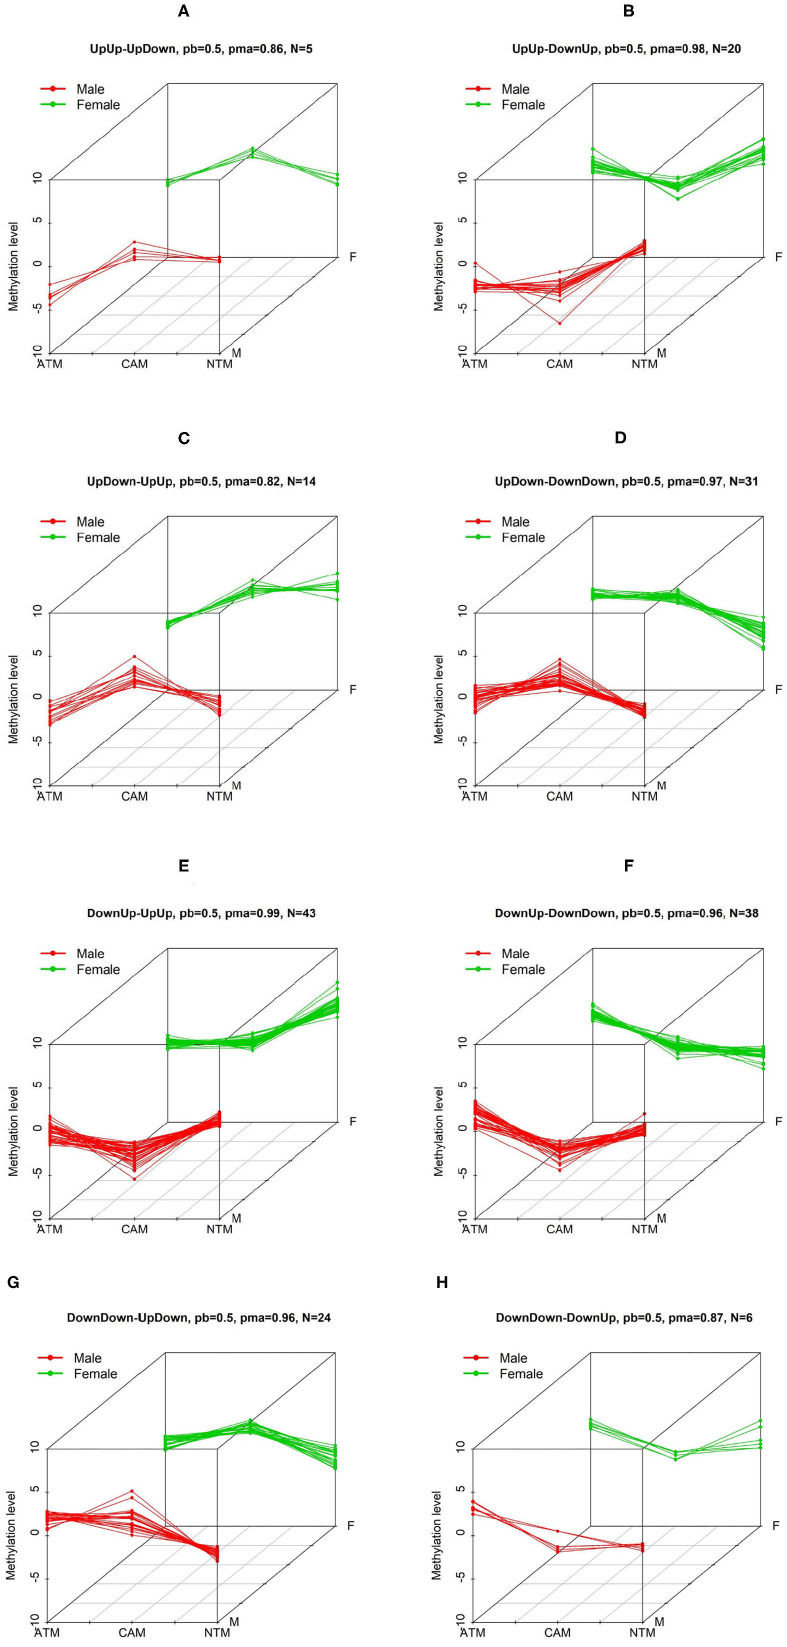
Figure 2.
The first 6 three-dimensional patterns of differential methylation levels. Two other patterns are shown below. Three-dimensional patterns of differential methylation levels. Eight patterns (A–H) with differential methylation levels between three groups (CAM, ATM, and NTM) when comparing male to female samples were identified by BACkPAy. Each group contains three samples (one male and two female samples or two male and one female samples). In each panel, N represents the number of differential methylation level probes belonging to one specific pattern with probability larger than pb = 0.5. pma is the maximum probability to belong to the corresponding pattern.

