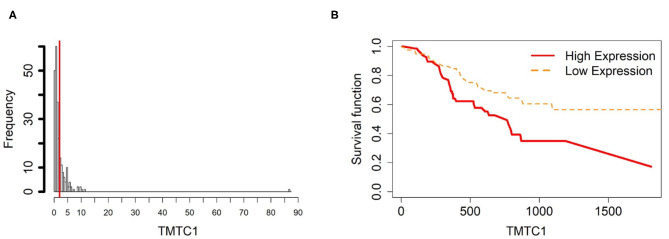
Figure 6.
Survival analysis in TMTC1. (A) Depicts the histogram of TMTC1 gene expression. Based on the TMTC1 data from TCGA-STAD, we set 2 as the gene expression threshold to separate the 238 observations into two groups: low expression and high expression groups of samples. (B) Shows the estimated survival function plots using a Cox proportional hazard regression analysis between the two groups; FDR p-value = 0.0325 indicates a significant survival time difference between the two groups.

