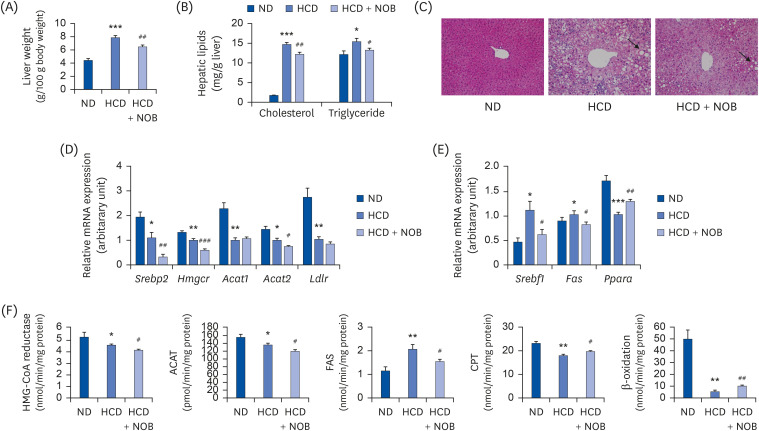
Fig. 3. Effect of NOB on liver weight (A), hepatic lipid content (B), liver morphology (C), expression of hepatic lipid metabolism-related genes (D, E), and activities of hepatic lipid metabolism-related enzymes (F) in HCD-fed mice. (A, B, D-F) Values are presented as mean ± SE (n = 12). Values are significantly different between the groups, according to the Student's t-test. (C) Representative photomicrographs of livers are shown at 200× magnification.
ND, normal diet; HCD, high-cholesterol diet (35 kcal% fat, 1.25% cholesterol, 0.5% cholic acid); HCD + NOB, high-cholesterol diet plus nobiletin (0.02%); mRNA, messenger RNA; HMG-CoA reductase, 3-hydroxy-3-methylglutaryl-CoA reductase; ACAT, acyl-CoA:cholesterol acyltransferase; FAS, fatty acid synthase; CPT, carnitine palmitoyltransferase.
*P < 0.05, **P < 0.01, ***P < 0.001, ND vs. HCD; #P < 0.05, ##P < 0.01, ###P < 0.001, HCD vs. HCD + NOB.

