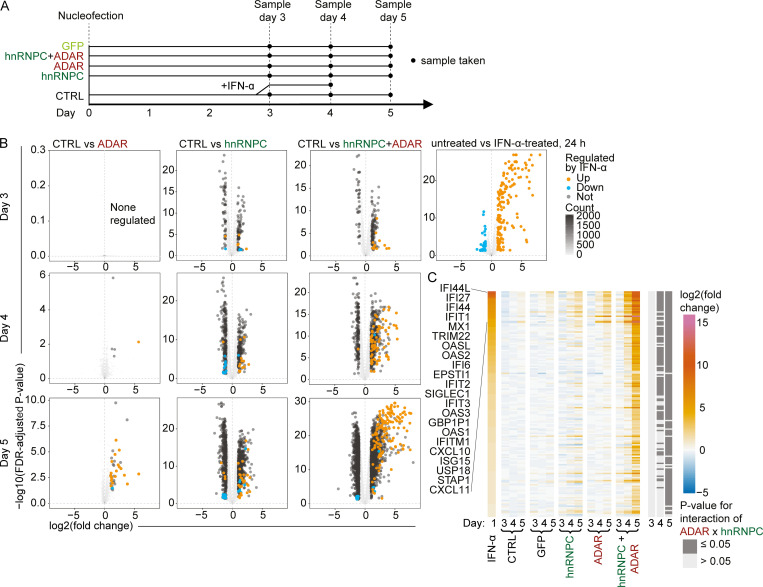
Figure 2.
RNA-seq analysis of gene expression confirms global ISG induction.(A) Schematic illustration of RNA-seq experimental design: THP-1 was nucleofected with gRNAs on day 0, and cells were harvested on days 3, 4, and 5. In addition, nontarget gRNA nucleofected cells were treated with IFN-α on day 3–4 for 24 h. (B) Differential expression analysis of RNA-seq data of THP-1 on day 3–5; comparisons are indicated. IFN-regulated genes are indicated (fold change ≥ 2 and FDR-adjusted P value ≤ 0.05). Only genes differentially regulated in the specific comparisons are displayed; all else are indicated by two-dimensional–density plotting. Correlation coefficient R between IFN-α–regulated genes in IFN-α–treated and ADAR+hnRNPC gRNA nucleofected cells on day 5: 0.889. (C) Heatmap of expression of IFN-regulated genes, displayed as fold-change relative to nontarget control (CTRL), ordered by fold-change in IFN-α–treated cells. Top IFN-α–induced genes are indicated. Dark gray annotation bars indicate significant ADAR × hnRNPC interaction (FDR-adjusted P value ≤ 0.05) in factorial analysis on days 3, 4, and 5 each. (B and C) Data are from three independent replicates.

