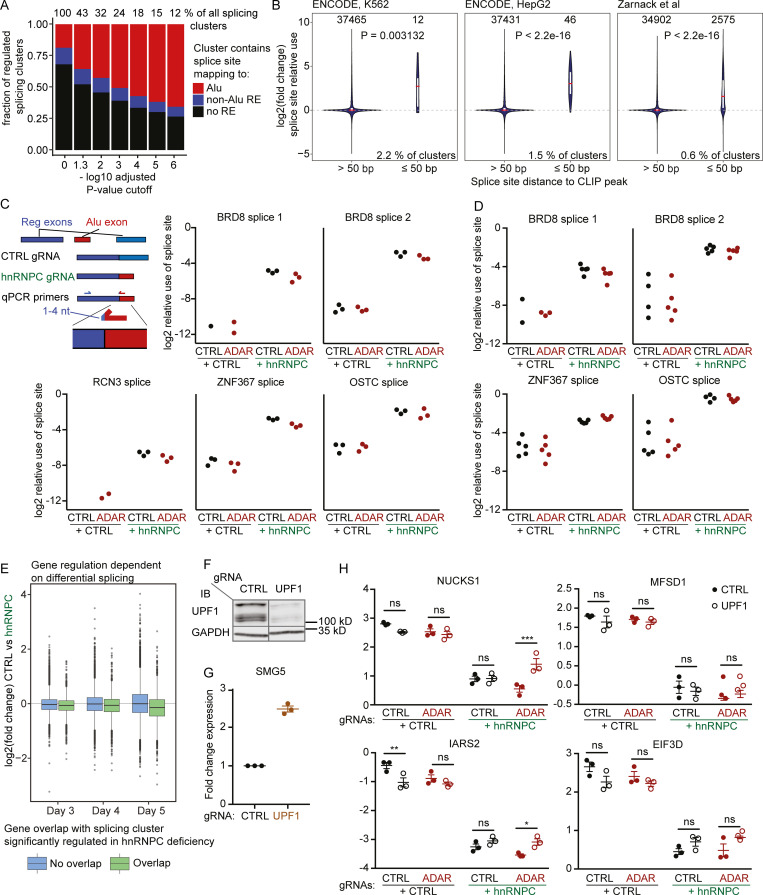
Figure 3.
Differential splicing and effects of NMD in hnRNPC deficiency.(A) Differential splicing between nontarget control (CTRL) and hnRNPC gRNA nucleofected THP-1 was analyzed as indicated in Materials and methods. Displayed is the relative number of differentially spliced clusters as a function of the FDR-adjusted P value cutoff. Clusters were stratified by the mapping of at least one splice site to one Alu element (red, Alu); no site mapping to Alu, but at least one site mapping to any other RepeatMasker element (blue, non-Alu RE); or no site mapping to any RepeatMasker element (black, no RE). Fractions of differentially regulated splice clusters relative to all clusters for each cutoff are indicated above the bars. (B) Relative use of splice sites within significantly regulated splice clusters (P ≤ 0.001), stratified by distance to the next CLIP peak as discovered by the ENCODE project or Zarnack et al. (2013). White bars indicate 25–75 percentile ranges; red line indicates median. P value for Wilcoxon’s rank sum test is indicated. Percentages indicate fractions of CLIP clusters that have ≤50-nt distance to splice junctions contained within significantly regulated splice clusters as defined above. (A and B) Data are from three independent experiments. (C and D) Confirmation of splice events in THP-1 (C) and MCF-7 (D). To achieve specificity, one primer was designed to match unique exonic sequences, and the second primer was designed to span the splice site with 1–4 nt matching the exon end. Individual symbols are replicates from three (C) or five (D) independent experiments. Missing circles, none detected. Data were normalized to CASC3 expression. (E) Log2 fold-change expression of genes upon hnRNPC deficiency on day 3–5, stratified by their genomic overlap with the location of a differentially regulated splice cluster (P ≤ 0.001). Data are from three independent experiments. (F) Western blot of CTRL or UPF1 gRNA-targeted cells. One representative of three experiments. WT and UPF1-targeted samples are from the same blot; irrelevant lanes were removed. IB, immunoblot. (G) Relative expression of SMG5 in CTRL or UPF1 gRNA-targeted THP-1. Expression was normalized to CASC3. Individual symbols are replicates from three independent experiments; mean ± SEM is depicted. (H) Expression of a selection of Alu-exon–containing transcripts that are down-regulated upon hnRNPC deficiency. Expression was normalized to CASC3 expression, log2 transformed, and analyzed by repeated-measures two-way ANOVA, and P values for individual comparisons were determined using Sidak’s post hoc test. Individual symbols are replicates from three independent experiments; mean ± SEM is depicted. *, P ≤ 0.05; **, P ≤ 0.01; ***, P ≤ 0.001. Probes were designed to not span the intron containing the Alu-exon. Closed circles, nontarget control gRNA; open circles, UPF1 gRNA.

