Figure 4.
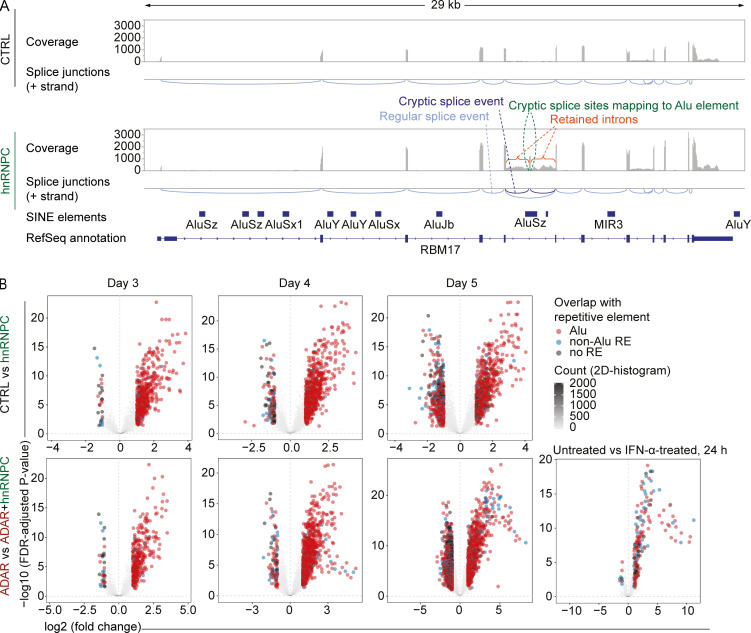
Dysregulation of introns in hnRNPC-deficient THP-1.(A) Raw coverage of RNA-seq reads and splice junctions estimated from split reads at the RBM17 locus (+ strand is shown only); analysis shown for cells 4 d after nucleofection with nontarget control (top) or hnRNPC gRNA (bottom). Canonical splice junctions shown in light blue, hnRNPC deficiency–dependent splice junctions in dark blue. One representative of three. (B) Differential expression analysis of intronic regions either of cells treated with recombinant IFN-α for 24 h (bottom) or nucleofected with control gRNA (CTRL), hnRNPC gRNA, ADAR gRNA, or both ADAR and hnRNPC gRNA for 3–5 d as indicated in Materials and methods. Comparisons are indicated (as in Fig. 2 B); data are from three independent experiments. 2D, two-dimensional.

