Figure 6.
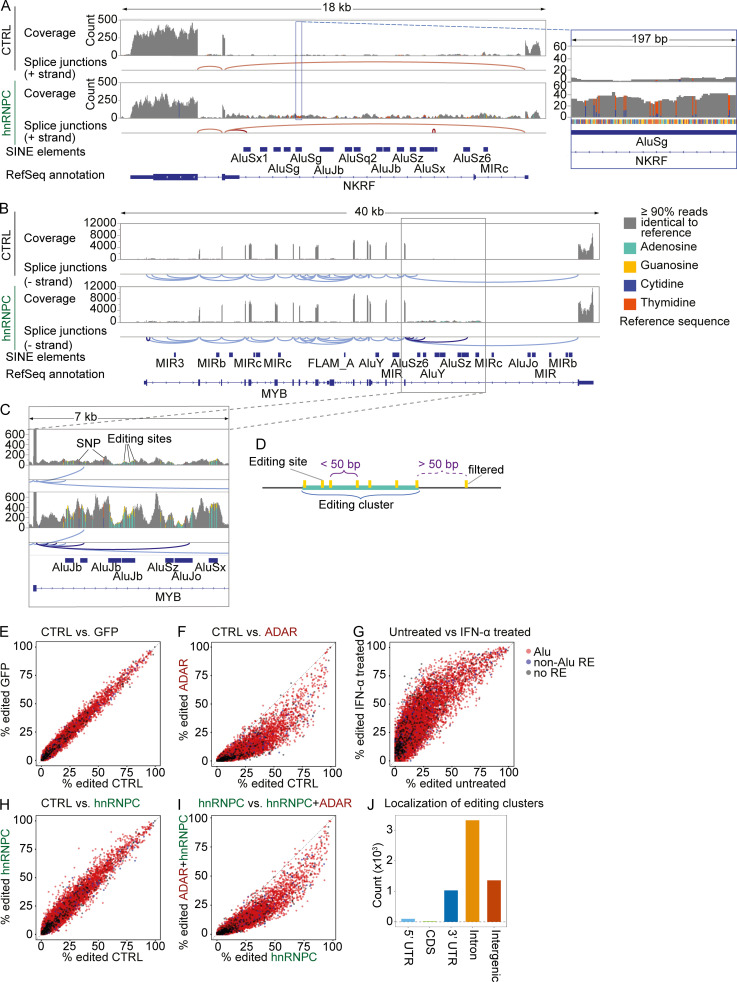
A-to-I editing sites mainly localize to Alu-elements and introns.(A–C) Exemplary raw coverage of RNA-seq reads and splice junctions estimated from split reads at the complete MYB locus (A, left, and B) and an intronic region of differential coverage within the gene (A, right, and C); analysis shown for cells 4 d after nucleofection with nontarget control (top) or hnRNPC gRNA (bottom). Data shown are from one representative of three independent experiments. Regular splice junctions shown in light red (A) or light blue (B and C); hnRNPC deficiency–dependent splice junctions in dark red (A) or dark blue (B and C). Bars are average coverage, gray, <10% reads differ from the reference sequence; colored bars indicate ≥10% of reads differ from reference. Green, A; orange, G; red, T; blue, C. Note that nongray bars are highlighted; columns widths are therefore not to scale. One representative of three. Note that NKRF is encoded on the (−) strand, causing A-to-I editing to appear as T-to-C transition. (D) Schematic illustration of editing cluster definition and editing clusters. Editing sites with distances 50 bp or lower were clustered; sites with longer distances were excluded from final selection. (E–I) Inosine frequencies at individual A-to-I editing sites in cells nucleofected with nontarget control gRNA (CTRL) or targeting GFP, ADAR, and/or hnRNPC, as indicated. Data are from three independent experiments. (J) Localization of editing clusters as defined in D.

