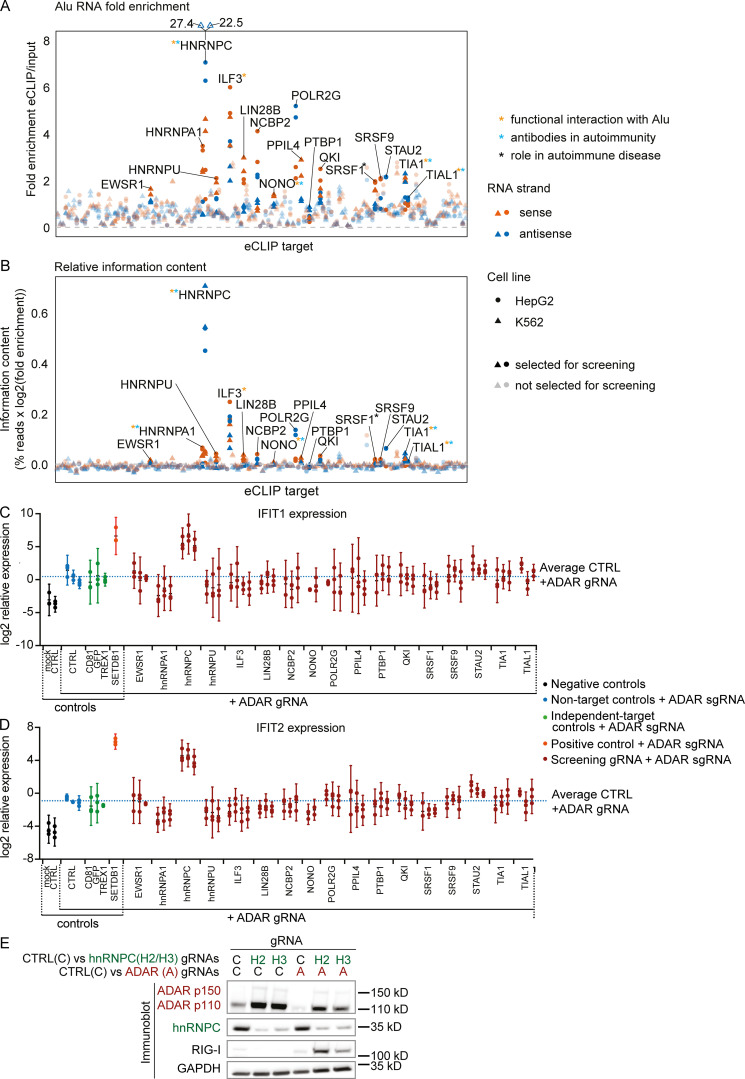
Figure S1.
Selection of screen candidates and IFIT1/2 expression in screen.(A and B) Fold enrichment (A) and relative information content (B) of Alu-element RNA for 150 eCLIP targets in alphabetical order. The targets selected for the screen are opaque and labeled. Colors indicate RNA strand: red, Alu RNA in sense orientation; dark blue, Alu RNA in antisense orientation. Shapes indicate cell line: circles, HepG2; triangles, K562. Asterisks marking the labels indicate literature showing functional interaction of the target with Alu RNA (orange), antibodies recognizing the target in autoimmunity (light blue), or the target playing a functional role in autoimmune disease (black). References are listed in Table S1. (C and D) IFIT1 (C) and IFIT2 (D) expression in THP-1 as in Fig. 1 B. Each set of aligned circles represents unique combinations of RBP targeting + ADAR gRNA (two to four individual gRNAs per RBP). Black, no ADAR targeting; blue, ADAR targeting+nontarget controls; green, ADAR targeting+non–RBP-negative controls; orange, ADAR-targeting + SETDB1 targeting–positive control; red, ADAR targeting+RBP targeting. Dotted blue line indicates average IFIT1 (C) or IFIT2 (D) expression across all ADAR+nontarget gRNA nucleofected samples. Log2 expression from three independent experiments is reported. Bars indicate 95% confidence intervals around mean. Successful CRISPR/Cas9 targeting was not confirmed at this stage. (E) Protein detection in THP-1 by Western blot as indicated in Fig. 1 C. One representative out of three experiments. gRNAs: C, Non-target control; H2/H3 hnRNPC gRNA #2 (used in Fig. 2 C); and #3, A, ADAR gRNA. CTRL, nontarget control; sgRNA, single-guide RNA.

