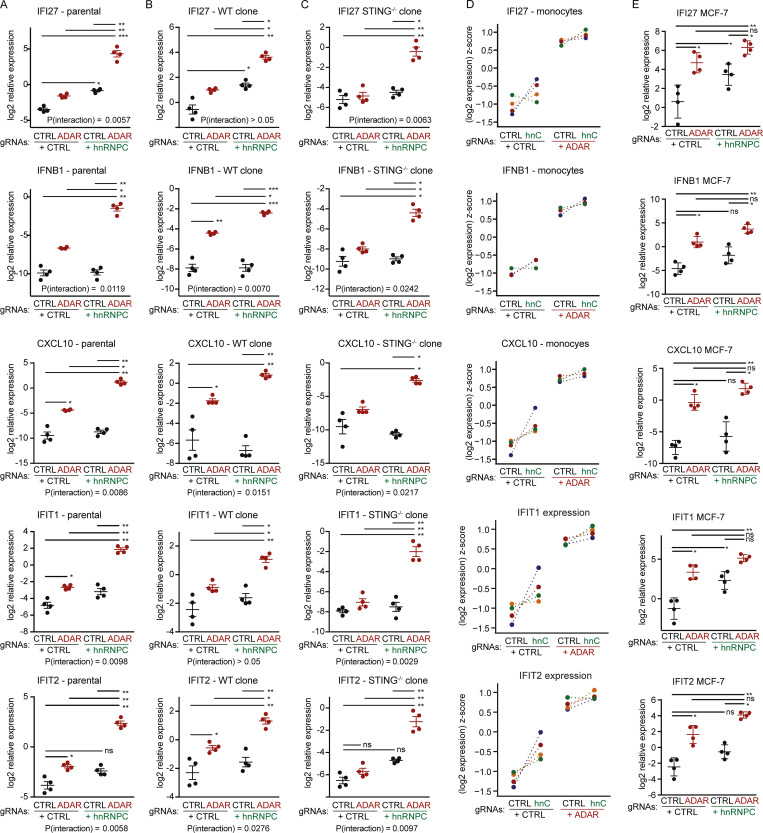
Figure S2.
Validation studies in further cell lines and primary cells.(A–E) Cells were nucleofected as in Fig. 1 C (A–C) or nucleofected with ribonucleoparticles with recombinant Cas9 and the indicated gRNAs (D and E), and normalized expression of the indicated genes on day 5 (A–C and E) or day 4 (D) is reported. Parental polyclonal WT Cas9-transgenic THP-1 cell line (A), a WT clone (B), a distinct STING-deficient clone (C), or MCF-7 (E) was used. Expression was normalized to RPL36 expression (A–C) or CASC3 expression (D and E), log2-transformed, and then analyzed by repeated-measures two-way ANOVA and P values for individual comparisons determined by Tukey’s post hoc test. *, P ≤ 0.05; **, P ≤ 0.01; ***, P ≤ 0.001 (A–C and E). Individual symbols are replicates from four independent experiments each; mean ± SEM is depicted. (D) Relative expression of the indicated genes in monocytes/early macrophages from four independent healthy donors 5 d after nucleofection of the indicated gRNAs. Data are displayed as donor-wise z-scores of log2-transformed relative expression; colors indicate individual donors. CTRL, nontarget control; hnC, hnRNPC.

