Figure S3.
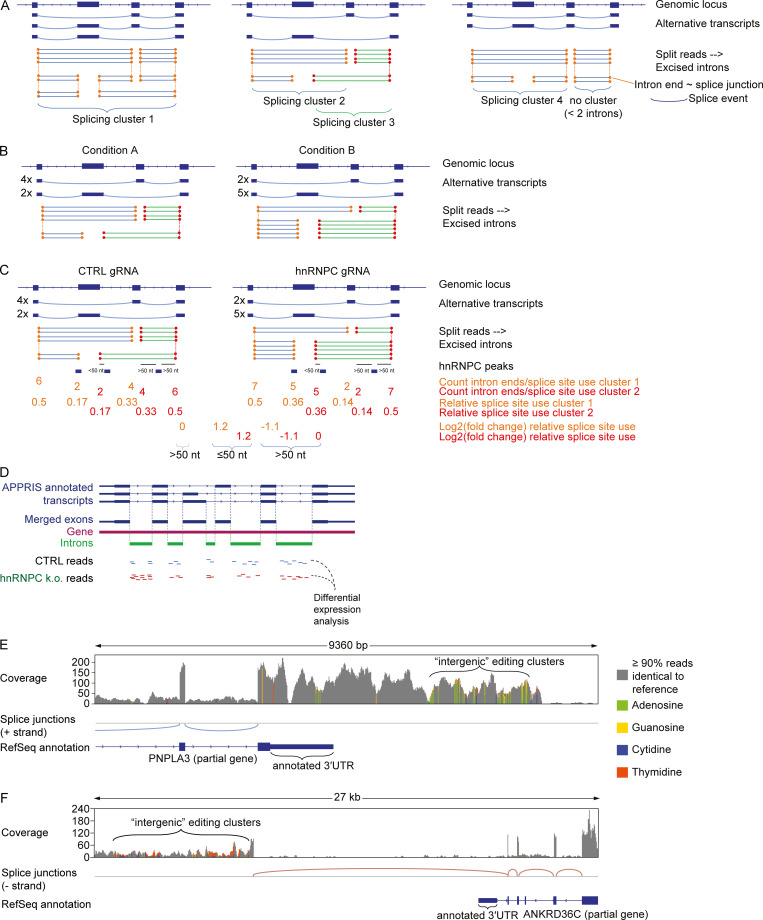
Alu-containing introns are dysregulated upon hnRNPC deficiency and examples of intergenic annotated editing clusters.(A) Examples of splicing clusters as defined by LeafCutter. Excised introns are deduced from split RNA-seq reads. Introns sharing ends (~splice sites, circles) are clustered, and clusters containing only one intron are excluded (as shown right). Alternatively spliced transcripts can result in one (left) or multiple (center) splice clusters. Adapted from Li et al. (2017). (B) Differential splicing is deduced from differential relative counts of excised introns. Both clusters in this example are differentially spliced. (C) Schematic illustration of relative splice site use quantification. Splice site use was estimated by aggregating intron counts sharing the same intron end; relative counts per cluster were calculated, and fold change between nontarget control and hnRNPC gRNA nucleofected THP-1 was determined. (D) Schematic illustration of differential expression analysis of intronic regions. Exons of APPRIS-annotated transcripts were merged and subtracted from the respective genes to yield intronic regions. RNA-seq reads mapping to these introns were subjected to intron-wise differential expression analysis. (E and F) Exemplary raw coverage of RNA-seq reads and splice junctions estimated from split reads at the PNPLA3 locus (E) and the ANKRD36C locus (F). Analysis shown for cells 4 d after nucleofection with nontarget control (E and F). RefSeq annotation is shown below. Bars are average coverage; gray: <10% reads differ from the reference sequence; colored bars indicate ≥10% of reads differ from reference. Green, adenosine; yellow, guanosine; blue, cytidine; orange, thymidine. Note that the gene in F is transcribed in (−)−strand direction: A-to-I editing appears as C-to-T transition. One representative of three. CTRL, nontarget control; k.o., knockout.

