Figure 1.
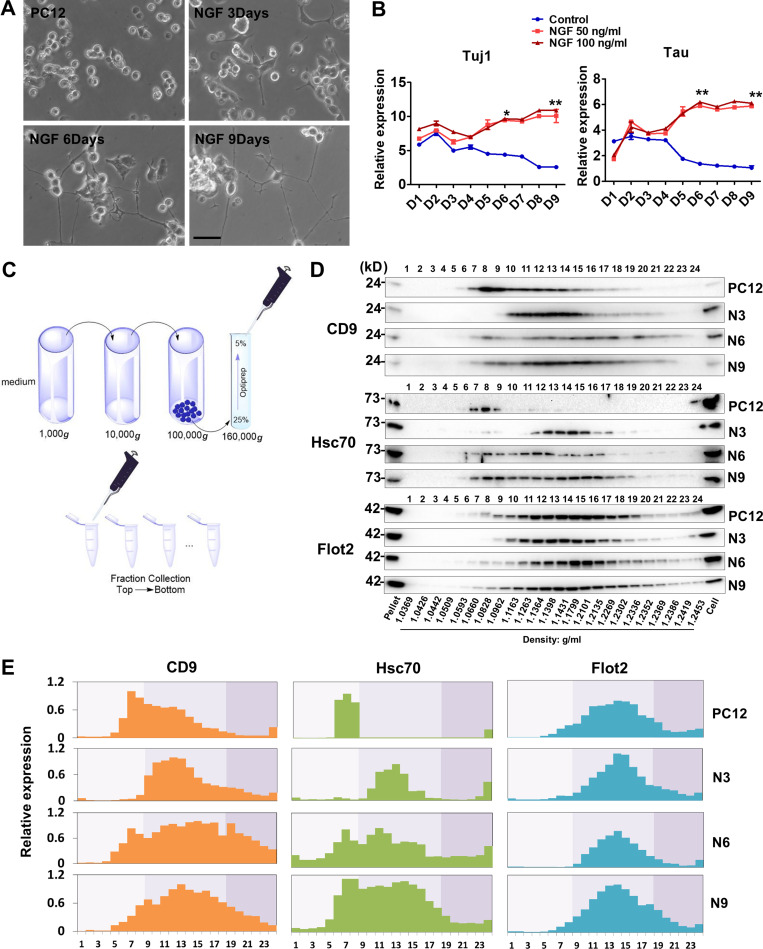
EVs show different buoyant density distribution during PC12 neuronal differentiation.(A) The cellular morphology of PC12 cells cultured in growth medium or low-serum medium with NGF (50 ng/ml) for 3, 6, and 9 d. Scale bars, 50 µm. (B) Expression profiling of Tuj1 and Tau genes during neuronal differentiation of PC12 cells in low-serum medium without (Control) or with different doses of NGF (50 and 100 ng/ml). Expression was normalized to Gapdh in this and all others by qPCR analysis. Data plotted are from three independent experiments, each with triplicate qPCR reactions; error bars represent SD from independent samples. The values represent the mean ± SD (*, P < 0.05; **, P < 0.01). (C) Schematic showing the fractionation of EVs. Differential ultracentrifugation was followed by buoyant density flotation in a linear iodixanol gradient. (D) Immunoblot of EV markers of the iodixanol linear gradient fractions purified from PC12 cells untreated or treated with NGF for 3, 6, and 9 d (N3, N6, and N9). Pellet, 5% of 100,000 g vesicle pellet fraction was loaded in gel. Cell, whole-cell lysate (10 µg) was loaded in gel. The density of each fraction is indicated at the bottom. (E) Relative expression of CD9, Hsc70, and Flot2 from fraction 1 to fraction 24 shown in D. Data plotted represent the mean value from three independent experiments.

