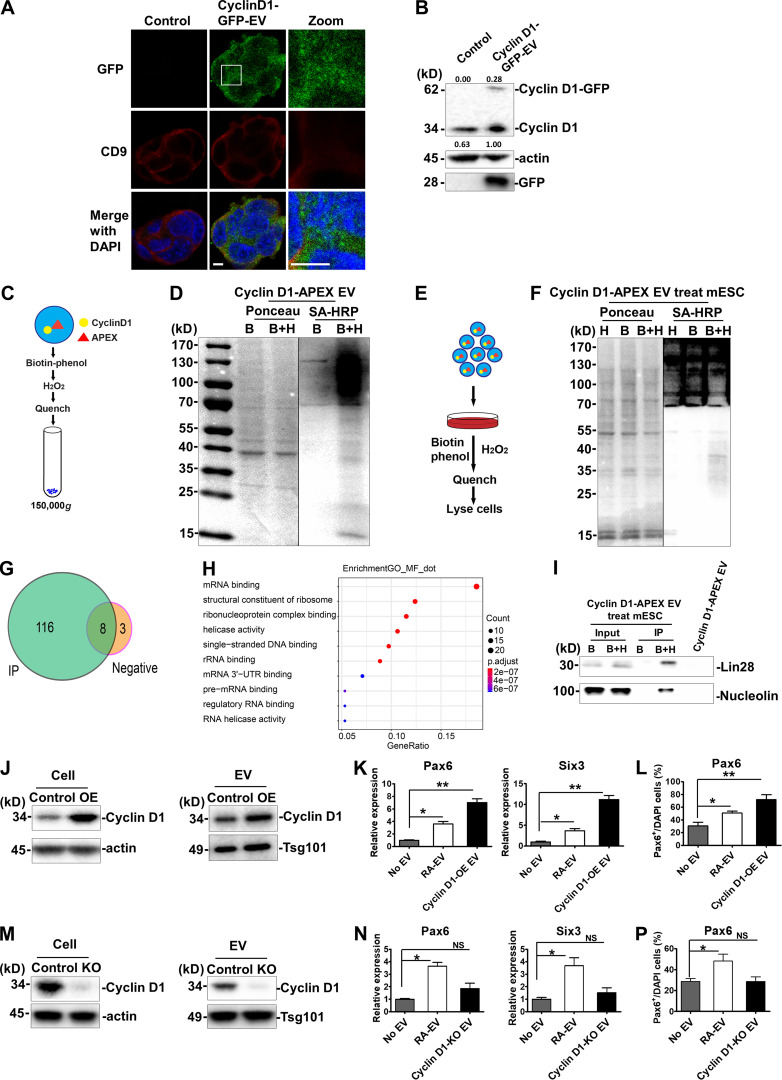
Figure 7.
Cyclin D1 is important for EV-mediated neural induction of mESCs.(A) Immunostaining of GFP (green, Alexa fluor 488) and CD9 (red, Alexa fluor 568) in differentiated mESC cells without (control) or with cyclin D1–GFP EV treatment. Magnified view is shown in panel 3. Nuclei were stained with DAPI. Scale bars, 5 µm. (B) Immunoblots of cyclin D1, actin, and GFP of differentiated mESCs without incubation or incubated for 4 d with cyclin D1–GFP EVs. Quantification of fusion protein uptake was calculated as the ratio of exogenous cyclin D1–GFP to endogenous cyclin D1. (C) Schematic of biotinylation labeling of cyclin D1–APEX EVs. (D) Streptavidin-HRP blotting analysis of biotinylated proteins in cyclin D1–APEX-expressing EVs. EVs were treated with biotin-phenol together with H2O2 (B+H) or not (B). Biotinylated protein was detected by blotting with streptavidin (SA)-HRP. Ponceau S staining (left of panel) of the same membrane serves as loading control. (E) Schematic of mESCs treated with cyclin D1–APEX EVs and biotinylated proteins labeled in differentiated mESCs. (F) SA-HRP blotting of biotinylated proteins in mESCs treated with cyclin D1–APEX EVs. (G) Venn diagram of the MS results. MS sample was collected as described in Materials and methods. Immunoprecipitation with streptavidin was used to enrich the biotinylated proteins. Diagram generated by Venn diagram package in the R program for statistical computing. (H) GO analysis of the MS results shown in G. GO analysis was generated by topGO package in the R program for statistical computing. (I) After the treatment described in E and F, immunoblots of Lin28 and nucleolin in differentiated mESCs treated with cyclin D1–APEX EVs. (J) Cyclin D1 was increased in the EVs from N2A cells overexpressing cyclin D1 (OE). The protein level of cyclin D1 was detected in control and OE samples. Actin was used as the internal control of whole-cell lysate, and Tsg101 was used as the loading control of EVs. (K) Gene expression level of Pax6, Six3, and Map2 was determined in differentiated mESCs treated without EVs and with RA-EV or OE EVs. The values represent the mean ± SD, from three independent experiments (*, P < 0.05; **, P < 0.01). Error bars represent SD from independent samples. (L) Quantitative analysis of the percentage of cells containing Pax6 normalized to DAPI stain in differentiated mESCs treated without EVs and with RA-EV or OE EVs. The values represent the mean ± SD, from two independent experiments (*, P < 0.05). Error bars represent SD from independent samples. (M) Cyclin D1 was absent from cyclin D1 knockout N2A cells and the EVs from cyclin D1 knockout (KO) N2A cells. The cyclin D1 protein was detected in control and KO samples. (N) The expression of Pax6, Six3, and Map2 was analyzed in differentiated mESCs treated without EVs and with RA-EV or cyclin D1 KO EVs. The values represent the mean ± SD from three independent experiments (*, P < 0.05; NS, P > 0.05). Error bars represent SD from independent samples. (P) Quantitative analysis of the percentage of cells containing Pax6 normalized to DAPI stain in differentiated mESCs treated without EVs and with RA-EV or cyclin D1 KO EVs. The values represent the mean ± SD, from two independent experiments (*, P < 0.05). Error bars represent SD from independent samples.

