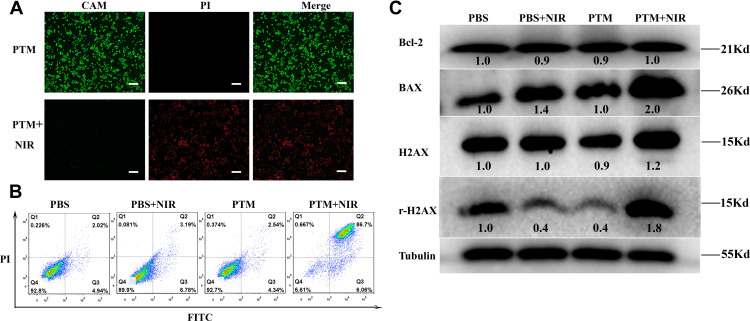
Figure 2.
(A) AM/PI fluorescence imaging of 4T1cells with PTM NPs (200 μg/mL) in the absence or presence of NIR laser irradiation (808nm, 1.5 W/cm2, 10 min). The scale is 100μm. (B) Representative FCM profiles of 4T1cells with PTM NPs (80 μg/mL) in the absence or presence of NIR laser irradiation (808 nm, 1.5 W/cm2, 5 min). (C) PTT induced the Bcl-2, BAX, H2AX, and γH2AX expression in 4T1 cells after different treatments.

