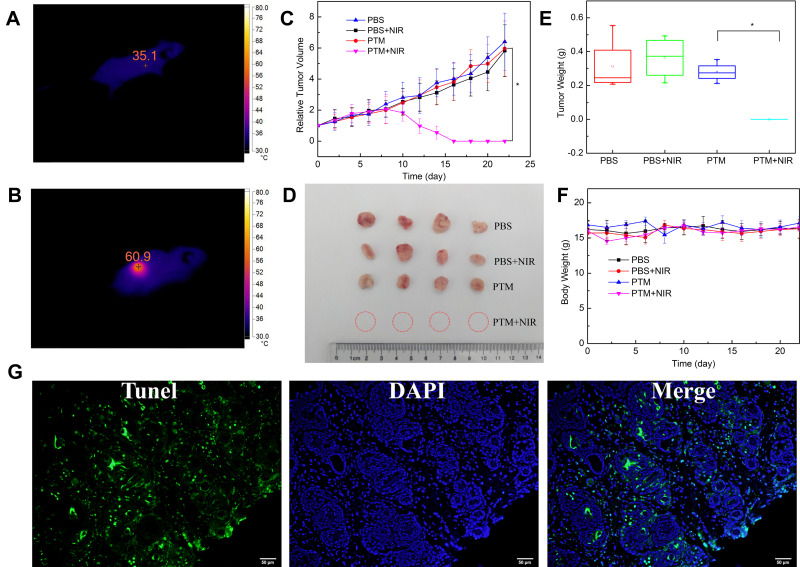
Figure 3.
(A) and (B) Tumor temperature of PTM + NIR laser irradiation group before and after irradiation (808nm, 1.0 W/cm2, 1 min). (C) Tumor growth curves of mice after different treatments. Results are expressed as mean ± S.E. * P < 0.05 compared with the PTM+NIR laser irradiation group. (D) Photographs of the dissected tumors after different treatment, (E) Dissected tumors weight after different treatment. Results are expressed as mean ± S.E. * P < 0.05 compared with the PTM+NIR laser irradiation group. (F) Body weight curve of mice after PTM+NIR laser irradiation group. (G) TUNEL assay of the tumor tissues after PTT.

