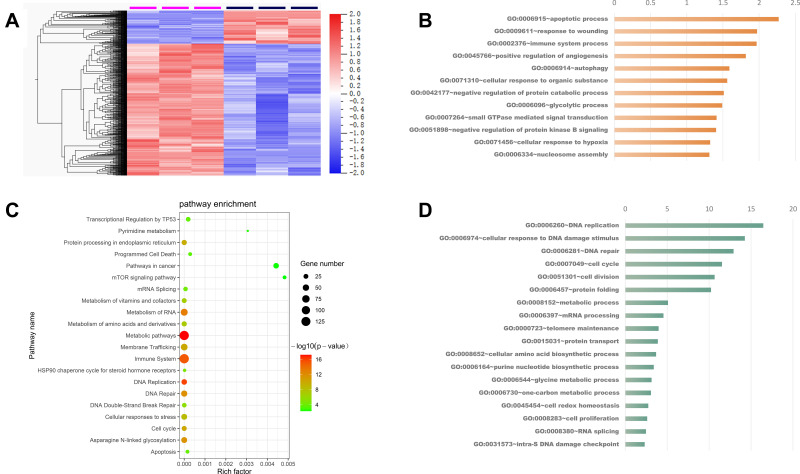
Figure 4.
(A) Heatmap showed the differential expressed genes after PTM NPs treated. (B) Enriched KEGG pathway analysis of differentially expressed genes after PTM NPs treated. (C) and (D) Enriched GO biological process of up-regulated genes (orange) and down-regulated genes (blue) in PTM NPs treated group. The X-axis of the histogram is -log10 (P-value) of individual terms calculated by right-sided hypergeometric test and corrected with Bonferroni. GO categories are indicated on Y-axis.

