Fig. 1.
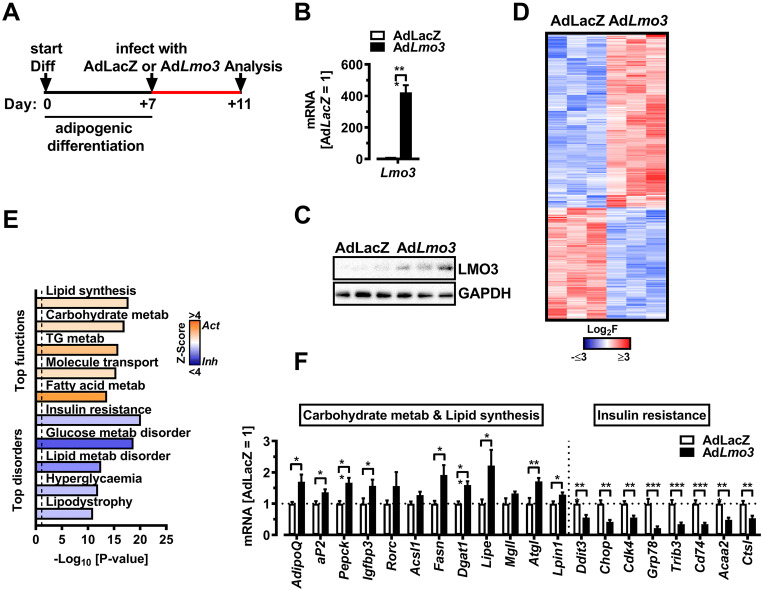
LMO3 rewires the metabolic transcriptional program in mature adipocytes. A Experimental design for analysis of LMO3 effects in mature 3T3-L1 adipocytes. B Lmo3 mRNA expression in mature 3T3-L1 adipocytes 3 days after infection with a control (AdLacZ) or Lmo3 containing (AdLmo3) adenovirus (n = 4). C LMO3 protein expression in mature 3T3-L1 adipocytes 3 days after infection with a control (AdLacZ) or Lmo3 containing (AdLmo3) adenovirus (n = 3). GAPDH demonstrates equal protein loading. D Heatmap of 1093 genes differentially regulated between AdLmo3- and AdLacZ-transduced 3T3-L1 adipocytes identified by RNA-Seq. Red and blue colors correspond to genes with statistically significant up- and downregulation, respectively (adjusted p-value < 0.05). E Ingenuity Pathway Analysis (IPA)-predicted molecular functions and disorders showing activation Z-scores (bars). Functions/disorders with an overlap p < 0.05 and Z-score −2 < or > 2 by IPA (see “Methods” for description) were predicted to be inhibited or activated. Dotted line indicates p < 0.05. F qRT-PCR analysis of selected genes from the Ingenuity Pathway Analysis (shown in G), (n = 5–7). IPA-predicted upstream regulators (center, colored by Z-score) and target genes (outer circle, colored by Fold Change) in AdLmo3- versus AdLacZ-transduced 3T3-L1 adipocytes

