Fig. 4.
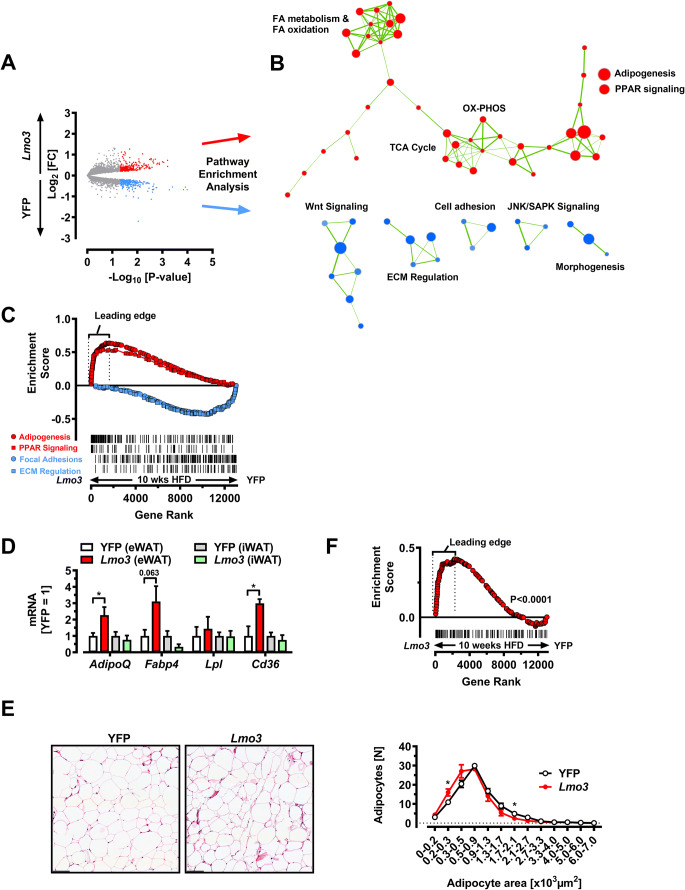
LMO3 targets PPARγ activity in eWAT during obesity. All data are derived from mice on HFD for 10 weeks following transduction of eWAT with either rAAV-YFP or rAAV-Lmo3. A Log2 fold changes in gene expression data obtained from microarray analysis of eWAT from obese mice (n = 3/group). Red and blue spots correspond to up- and downregulated genes when comparison Lmo3- with YFP gene expression. B Cytoscape enrichment map (p-value cutoff: 0.005, FDR Q-value cutoff: 0.1, overlap cutoff: 0.5) of gene set enrichment analysis (GSEA). Gene sets enriched in viWAT from rAAV-Lmo3 or rAAV-YFP-transduced mice are indicated in red and blue nodes, respectively. Nodes represent gene sets and edges represent mutual overlap. C GSEA of eWAT from obese mice. Nominal ES P-value < 0.0001 for “Adipogenesis” & “PPAR signaling” and for “Focal adhesion” and “ECM Regulation,” respectively. Vertical lines for visualization only. D Q-PCR analysis in eWAT and iWAT from obese mice of PPARγ target genes (n = 6/group). E Left panel: Representative H&E images of eWAT from rAAV-YFP- or rAAV-Lmo3-transduced mice. Scale bar 100 μm. Right panel: Quantification of adipocyte size. Total 250–350 cells per group were measured (n = 4/group). F GSEA of eWAT from obese mice. Nominal ES P-value < 0.0001 for a custom-gene set derived from human adipose tissue displaying adipose hypertrophy or hyperplasia [31]. The leading edge of this gene set includes genes implicated in lipid droplet growth and regulation of adipocyte morphology including Cidea [58], Pparα [59], and Bnip3 [60]. *p < 0.05, **p < 0.01, ***p < 0.001, ns, not significant

