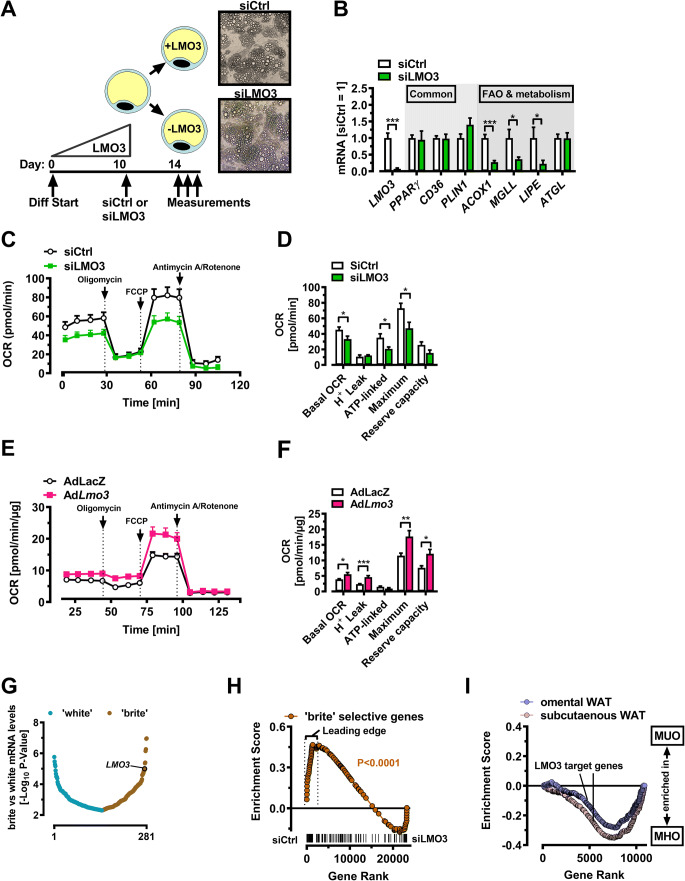
Fig. 7.
LMO3 promotes mitochondrial oxidative capacity in human mature adipocytes. A Experimental scheme for silencing LMO3 in human mature adipocytes. Photomicrographs show mature adipocytes 4 days after siRNA transfection. B Q-PCR analysis of selected genes from siCtrl or siLMO3-transfected human mature adipocytes (n = 5–7). C OCR of siCtrl- or siLMO3-transfected human mature adipocytes (n = 8–11). D OCR and mitochondrial function parameters of siCtrl- or siLMO3-transfected human mature adipocytes (n = 8–11). E OCR of AdLacZ- or AdLmo3-transduced human mature adipocytes (n = 11). F OCR and mitochondrial function of AdLacZ- or AdLmo3-transduced human mature adipocytes (n = 11). G Rank order of 281 human white adipocyte genes correlating with forskolin treatment (forskolin vs. vehicle, P-value < 0.005) obtained from public data [41]. H GSEA of genes induced in “brite” adipocytes [41] in siCtrl- versus siLMO3-transfected mature human adipocytes. P-value of the Nominal Enrichment Score for the indicated gene set is indicated. I GSEA of adipocyte LMO3 target genes in WAT derived from metabolically “healthy” (MHO) or “unhealthy” (MUO) morbidly obese patients based on HOMA-IR [42] using a custom gene set composed of LMO3-regulated genes in human mature adipocytes. Note that LMO3-induced genes are enriched in MHO patients. NES P-value < 0.0001 for both, omental and subcutaneous WAT. *p < 0.05, **p < 0.01, ***p < 0.001, ns, not significant

