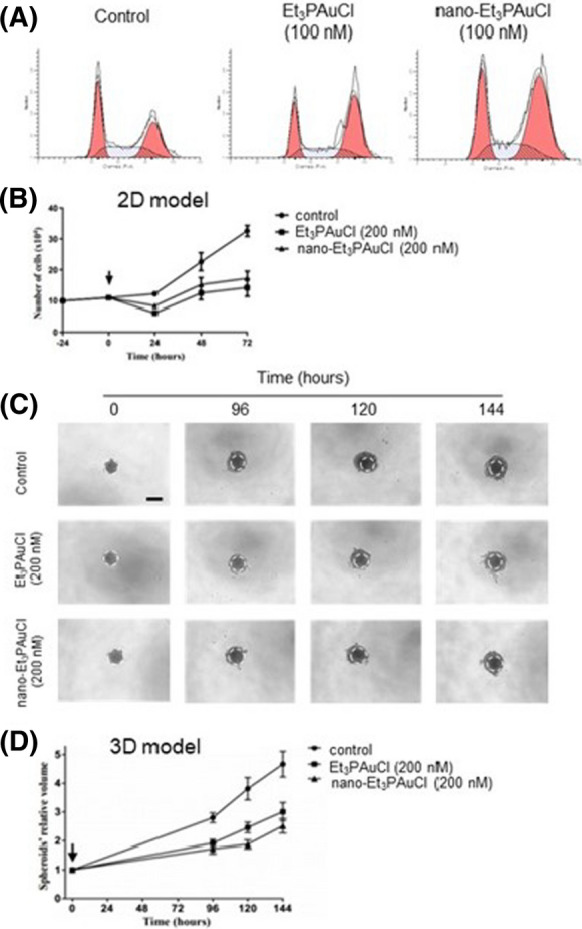
Fig. 4.

Analysis of the Et3PAuCl and its encapsulated form on cell cycle distribution and their effects in 2D and 3D cell cultures. a: Representative histograms of data shown on Table 2. b Effects on HCT-116 cells proliferation after incubation with 200 nM Et3PAuCl and its encapsulated formulation for 24, 48 and 72 h. The determination of viable cell was calculated using Trypan Blue exclusion test. Results report average value of three independent experiments ± SEM. The significance of differences between groups was calculated through t test. *p < 0.05; **p < 0.01. (Ctrl vs Et3PAuCl 24 h, p = 0.0011; ctrl vs nano-Et3PAuCl 24 h, p = 0.0058; ctrl vs Et3PAuCl 48 h, p = 0.047; ctrl vs Et3PAuCl 72 h, p = 0.0053; ctrl vs nano-Et3PAuCl 72 h, p = 0.0066). c Typical original spheroid images of various time conditions. Scale bar = 100 µm. d Histogram pertinent to relative volume of HCT116 spheroids exposed to Et3PAuCl and its encapsulated form (0 and 200 nM) for 0, 96, 120, 144 h. This study used the high-throughput image analysis software SpheroidSizer. Data are given by three independent experiments ± SEM. Spheroid volumes were investigated by Matlab as reported in the “Methods” section. The significance of differences between groups was calculated through t test. *p < 0.05; **p < 0.01. (Ctrl vs Et3PAuCl 96 h, p = 0.0012; ctrl vs nano-Et3PAuCl 96 h, p = 0.0009; ctrl vs Et3PAuCl 120 h, p = 0.0083; ctrl vs nano-Et3PAuCl 120 h, p = 0.0026; ctrl vs Et3PAuCl 144 h, p = 0.0112; ctrl vs nano-Et3PAuCl 144 h, p = 0.0023)
