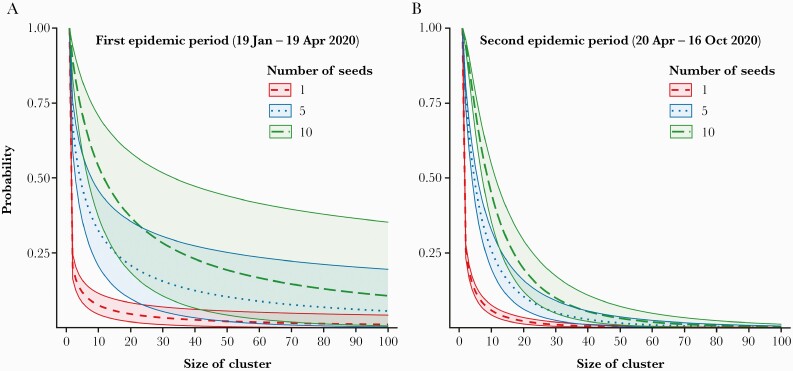
Figure 2.
The expected probabilities that the different numbers of index cases generate clusters of given size during (A) the first epidemic period (19 Jan–19 April 2020) , and (B) the second epidemic period (20 Apr–16 Oct 2020). Dashed, dotted, and long-dashed lines indicate the median estimates of the expected probabilities that 1, 5, and 10 infectors generate clusters of a given size, respectively. The green, red, and blue areas covered by solid lines indicate 95% credible intervals.

