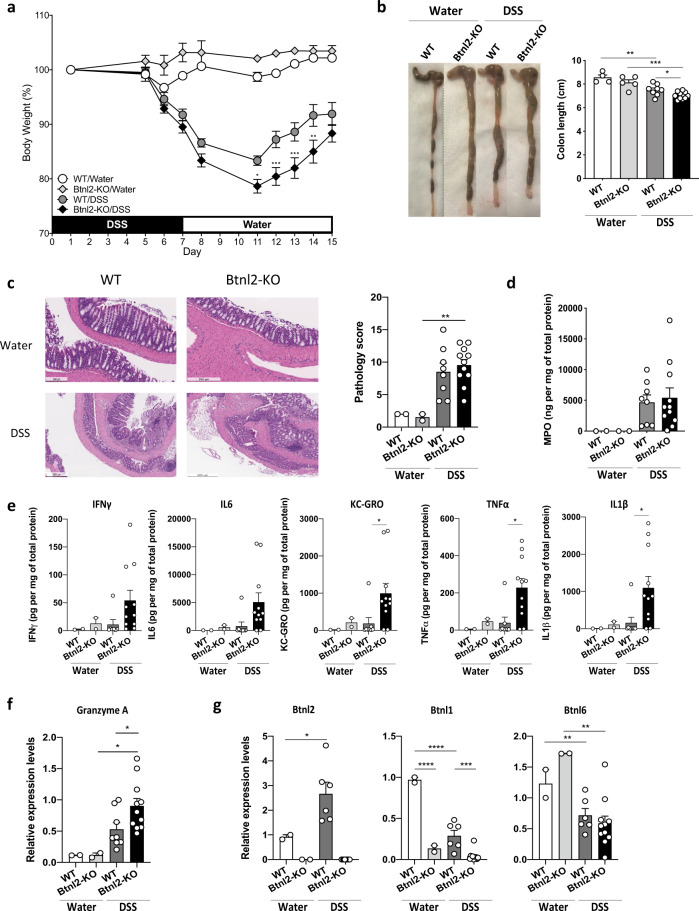
Fig. 7. Btnl2-KO mice exhibit more severe intestinal inflammation in chronic DSS-induced colitis.
Cohoused 15-week-old Btnl2-KO (n = 11) and WT (n = 8) littermates were subjected to 3% DSS-induced colitis for 7 days followed by water for 8 days. Control mice (n = 2–4) received water. a Body weight loss in cohoused Btnl2-KO and WT littermates calculated as the percent difference between the initial and actual body weight on the above days. Error bars represent mean ± SEM. Significance is measured using unpaired t-tests assuming similar SD, *p < 0.05, **p < 0.005, ***p < 0.0005, significantly different from DSS-treated WT mice. b Colon length of water- and DSS-treated Btnl2-KO and WT mice on day 15. c H&E histological sections and a pathological score of the colon from water- and DSS-treated Btnl2-KO and WT mice. Scale bars are 200 μm (WT/water), 250 μm (Btnl2-KO/water), 500 μm (WT/DSS and Btnl2-KO/DSS). d Myeloperoxidase (MPO) activity in colon homogenates of water- and DSS-treated Btnl2-KO and WT mice. e Levels of pro-inflammatory cytokines in colon homogenates of water and DSS-treated Btnl2-KO and WT mice. f Granzyme A mRNA levels in colon homogenates of water- and DSS-treated Btnl2-KO and WT mice, normalized to β2m. Error bars represent mean ± SEM. Significance is measured using unpaired t-tests assuming similar SD, *p < 0.05. g Btnl1/2/6 mRNA levels in the colon of water- and DSS-treated WT mice, normalized to β2m. Error bars represent mean ± SEM. Significance is measured using one-way ANOVA, *p < 0.05, **p < 0.005, ***p < 0.0005.

