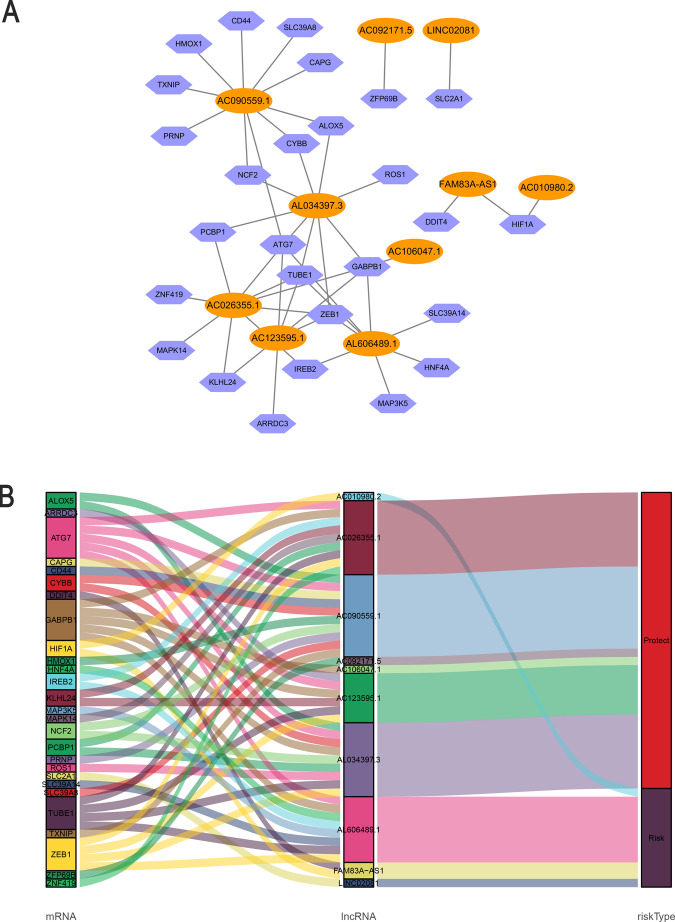
Fig. 2. Coexpression network and Sankey diagram of prognostic ferroptosis-related lncRNAs.
A A coexpression network of ferroptosis-related lncRNAs and mRNAs was constructed and visualized using Cytoscape. Orange ellipses indicate prognostic lncRNAs, and blue violet diamonds indicate ferroptosis-related mRNAs. The levels of the 10 ferroptosis-related lncRNAs were associated with the levels of 27 ferroptosis mRNAs. B Sankey diagram showing the associations between prognostic ferroptosis-related lncRNAs, mRNAs, and risk type.

