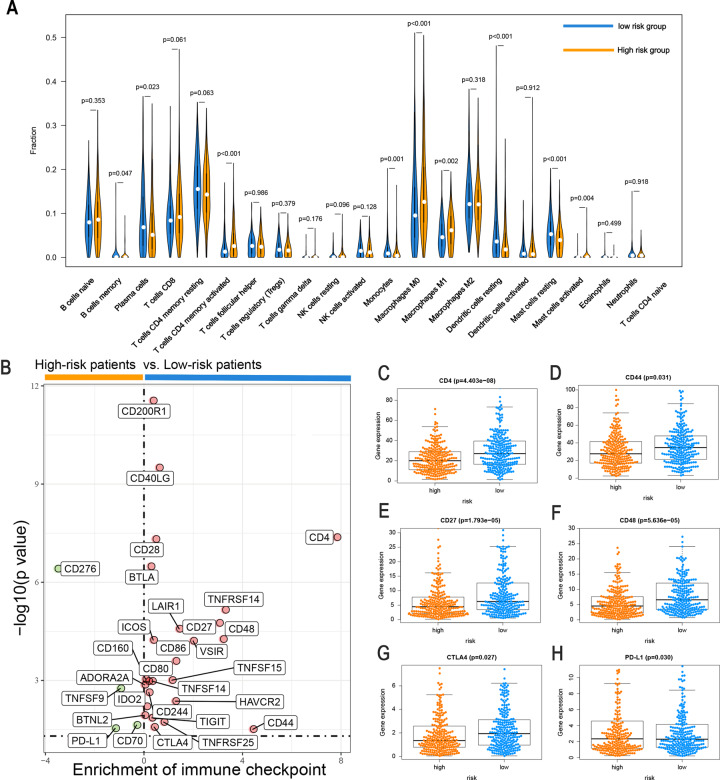
Fig. 8. Comparison of the immune microenvironment and immune checkpoints with LUAD between the high-risk and low-risk groups.
A Violin plot of immune-infiltrating lymphocytes between the low-risk and high-risk groups, in which orange indicates high-risk samples and blue indicates low-risk samples. B Volcano plots for the enrichment of expression of immune checkpoints between the low-risk and high-risk groups. The differential expression of six immune checkpoints, (C) CD4, (D) CD44, (E) CD27, (F) CD48, (G) CTLA4, and (H) PD-L1, between the high-risk group and the low-risk group. Orange indicates high-risk patients, and blue indicates low-risk patients.

