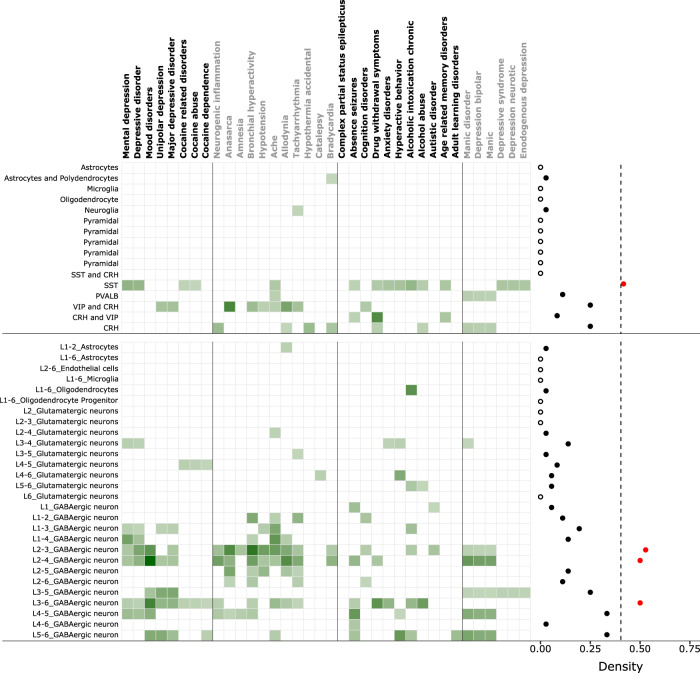
Fig. 3. Cell-type analysis of psychiatric cluster disorders.
Enrichment of different cell-types (top-left labels) and layer-specific cell-types (bottom-left labels) markers across psychiatric cluster disorders (top labels). Right: Density of each cell-type (top) and layer-specific cell-types (bottom) across all disorders. The filled red dots crossing the threshold (arbitrary) of 0.4, represent high-density cell-types whereas hollow dot represents a cell-type with zero density. Note the highest density of SST-positive interneurons and layer 2/3 specific interneurons across all disorders. The color-intensity (light to dark green) in the heatmap is proportional to −log10(q value).

