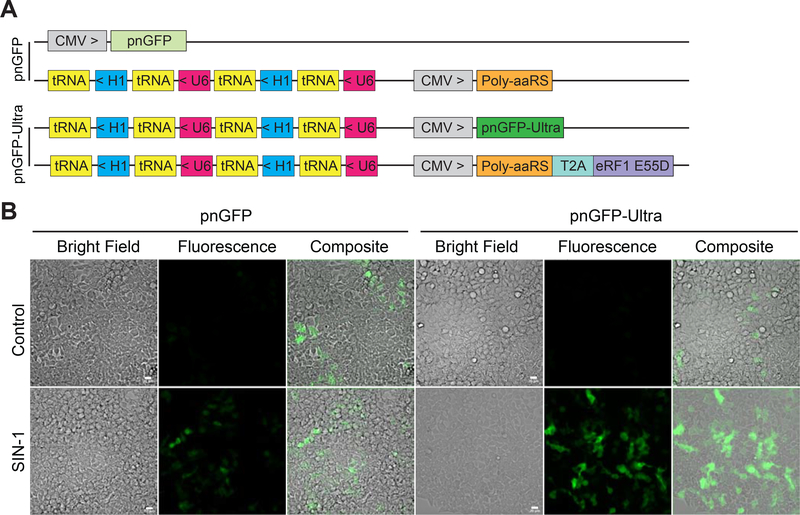
Figure 5. Live-cell imaging of peroxynitrite in HEK 293T cells.
(A) Constructs used for expressing pnGFP (top two plasmids) and pnGFP-Ultra (bottom two plasmids).
(B) Green fluorescent and bright-field images of cells expressing pnGFP (left) or pnGFP-Ultra (right). In the bottom row, HEK 293T cells in HBSS were treated with 100 μM SIN-1 for 90 min before imaging. Experiments were repeated three times with independent cultures and similar results were obtained. Scale bar, 20 μm.

