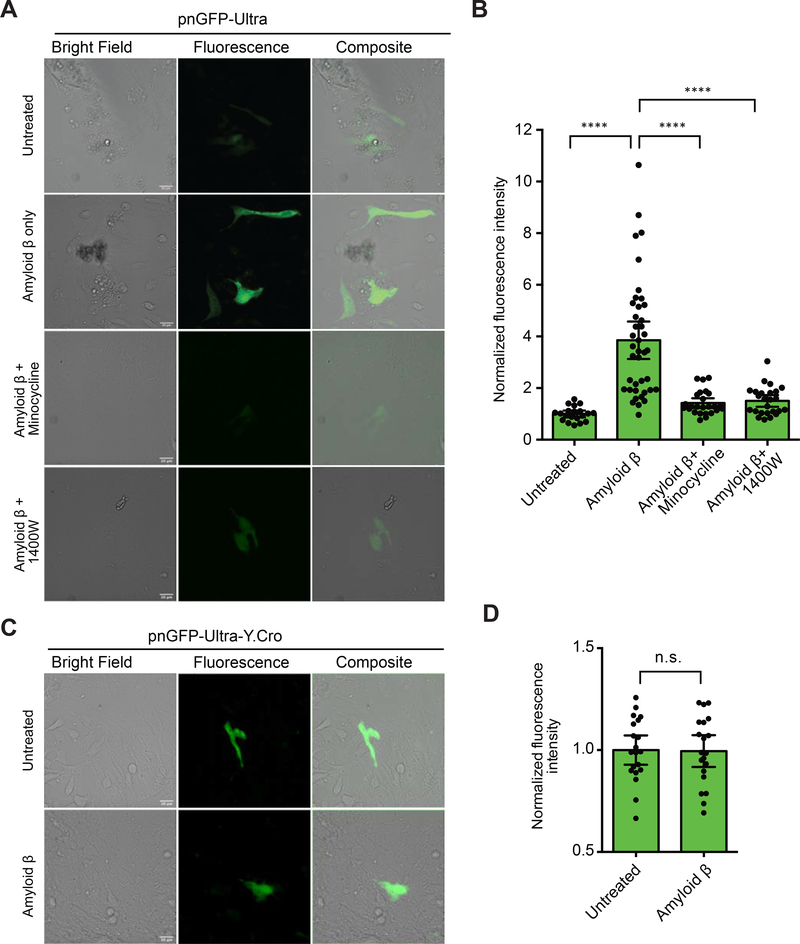
Figure 7. Live-cell Imaging of Amyloid β-Induced Peroxynitrite in Primary Glial Cells.
(A) Primary mouse glia cells were isolated and transfected with pnGFP-Ultra. After 24 hours, the samples were untreated or treated with amyloid β (5 μM) in the absence or presence of an ONOO− scavenger (minocycline) or an iNOS inhibitor (1400W) for 42 hours before imaging. Representative bright field (left), fluorescence (middle) and overlay (right) images of each group were shown. Experiments were repeated three times with independent cultures and similar results were obtained. Scale bar, 20 μm.
(B) Quantification of fluorescence intensities of cells in each treatment group in panel A. Data are presented as mean ± 95% confidential intervals and black dots indicate fluorescent intensities of single cells (n = 20, 40, 25, and 25 individual cells from 3 independent cultures for untreated, amyloid β-treated, amyloid β and minocycline-treated, and amyloid β and 1400W-treated groups, respectively). Statistical test was performed using Brown-Forsythe and Welch’s ANOVA followed by Dunnett’s T3 multiple comparisons test (****P < 0.0001).
(C) Primary mouse glia cells expressing pnGFP-Ultra-Y.Cro (which contains a tyrosine-derived chromophore) untreated or treated with amyloid β (5 μM) for 42 hours before imaging. Experiments were repeated three times with independent cultures and similar results were obtained. Scale bar, 20 μm.
(D) Quantification of fluorescence intensities in panel C. Data are presented as mean ± 95% confidential intervals and black dots indicate fluorescent intensities of single cells (n = 20 individual cells from 3 cultures for each group). Comparison was made using an unpaired two-tailed t-test (n.s., not significant, P > 0.05).

