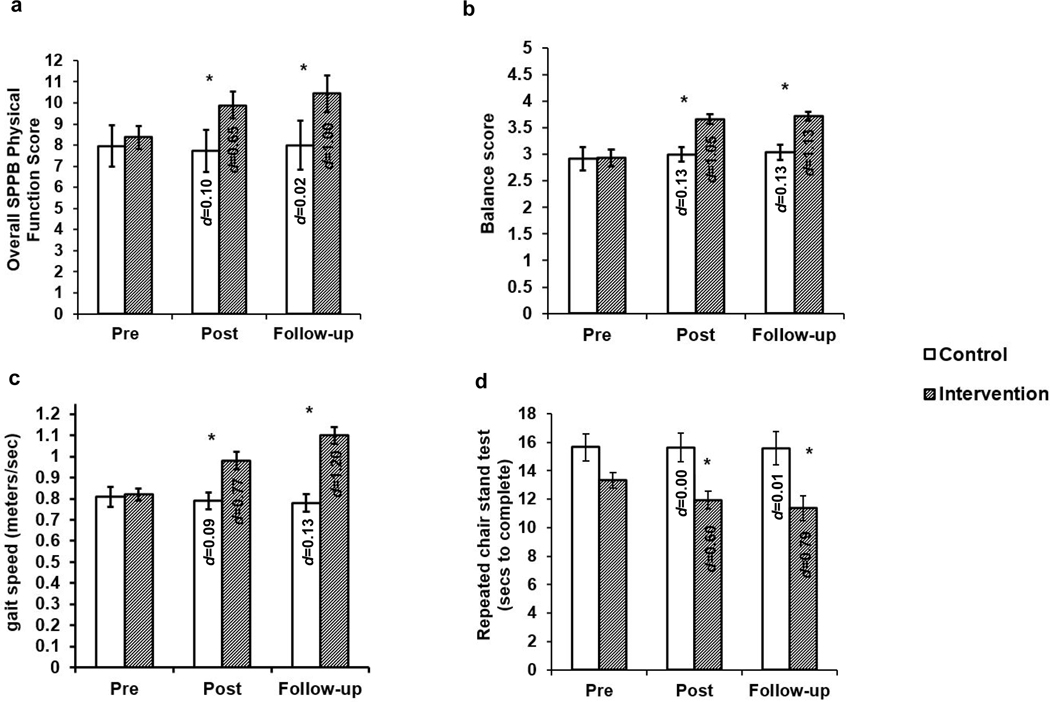
Figure 2.
Physical function outcomes prior to and following the sedentary behavior intervention for wait-list control and intervention groups. a) = overall physical function score; b) = balance score; c) = gait speed in meters per second; d) = repeated chair stand test (i.e., seconds to complete). *= significant group x time interaction. Physical function data was obtained from administration of the Short Physical Performance Battery (SPPB). Cohen’s d effect sizes (within-group) from pre- to post-intervention and pre-intervention to follow-up are included in the bar graphs (i.e., value listed in post bar graph is the within group effect size from pre- to post-intervention, and value listed in the follow-up bar graph is the within-group effect size from pre-intervention to follow-up).

