Fig. 4.

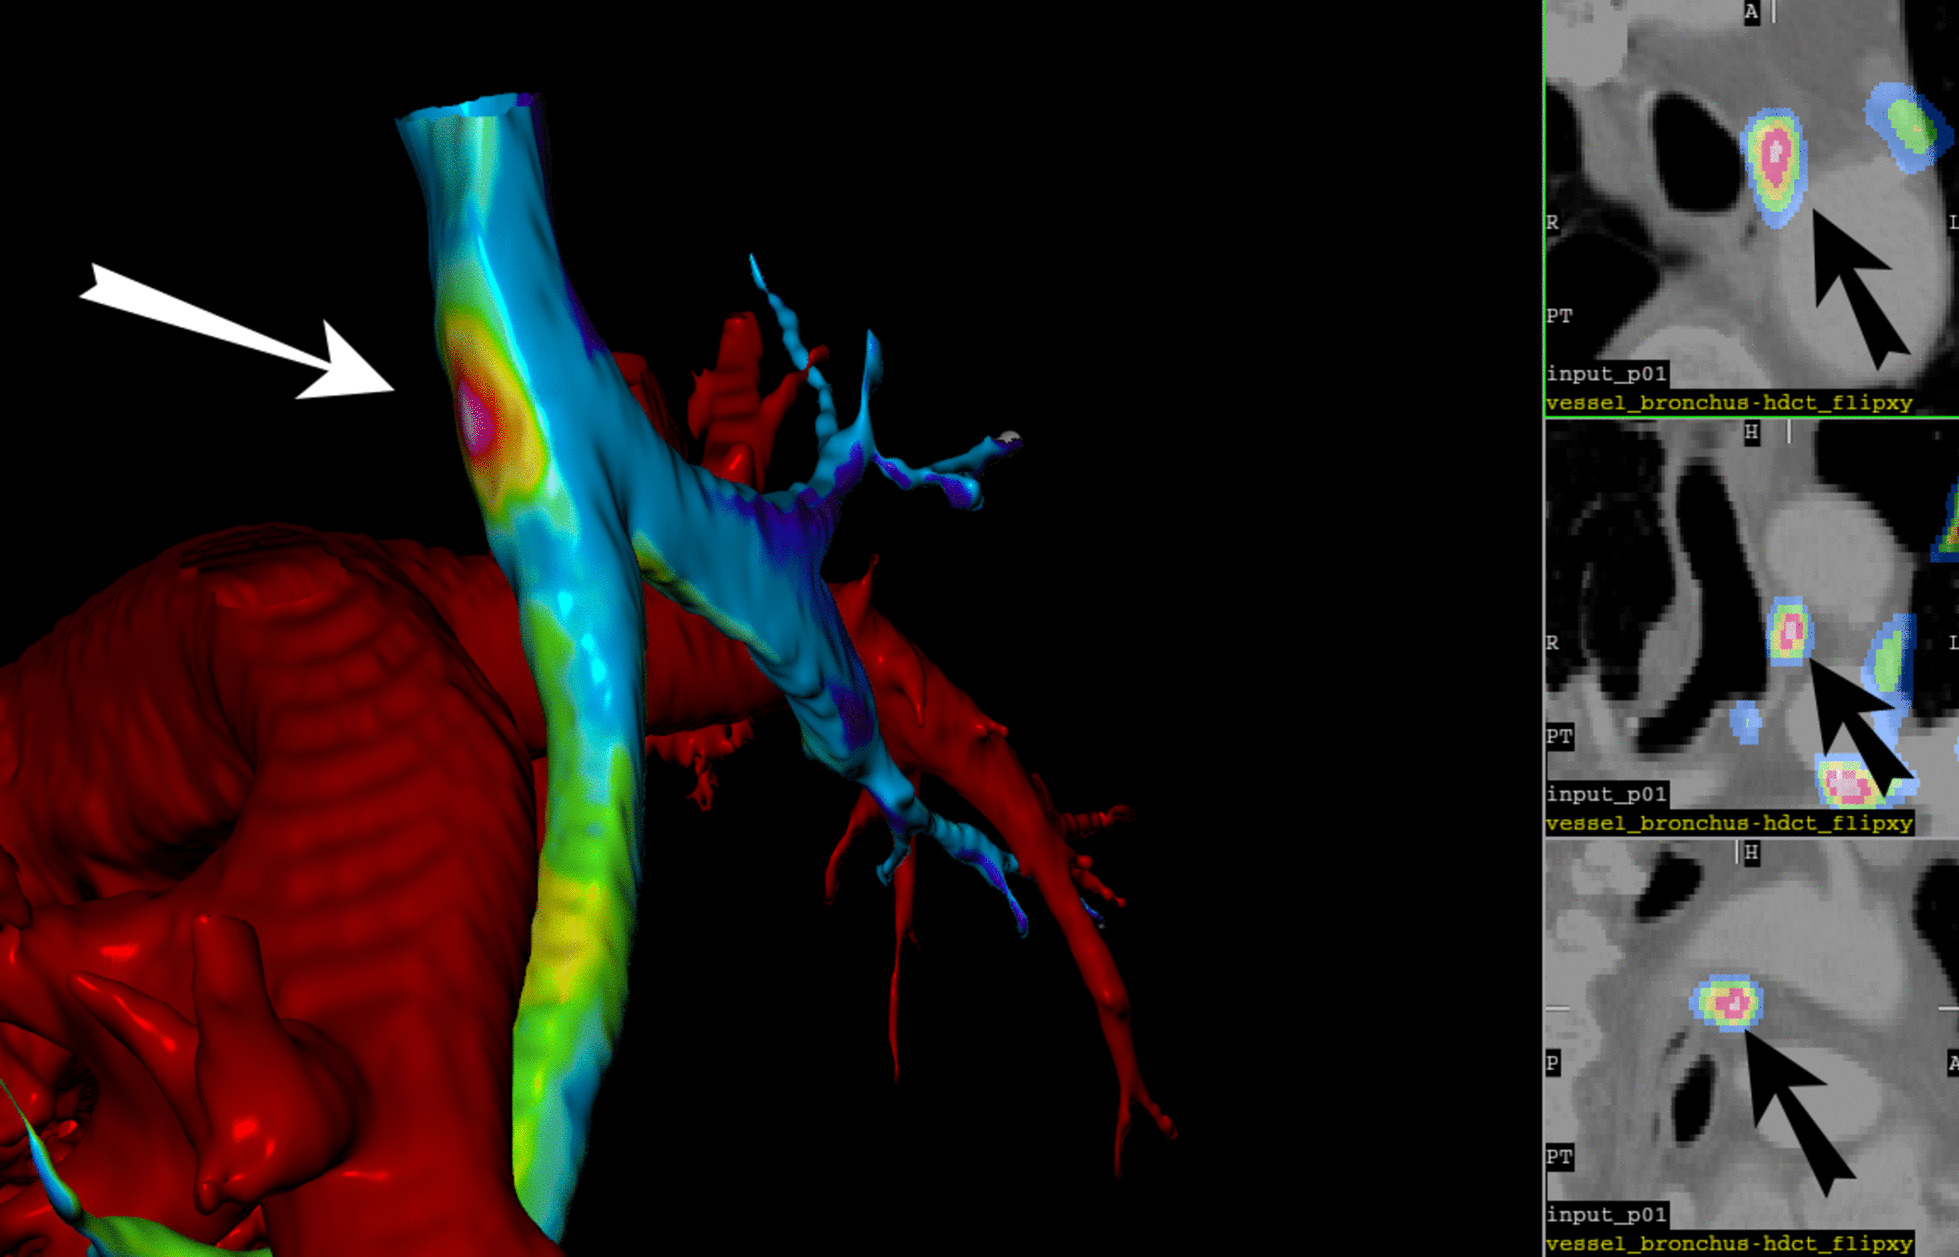
Visualisation of the airway tree and blood vessels from the outside (left) and orthogonal sections in the vicinity of the lesion indicated by the arrow (right). The projected FDG accumulation in the lesion is displayed in spectral scale

Visualisation of the airway tree and blood vessels from the outside (left) and orthogonal sections in the vicinity of the lesion indicated by the arrow (right). The projected FDG accumulation in the lesion is displayed in spectral scale