Fig. 6.

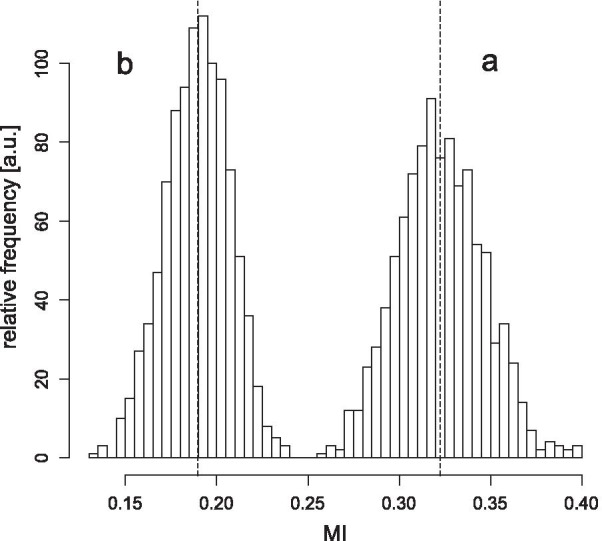
MI distribution calculated from the bootstrapped samples (a: for the accepted registrations; b: for the rejected registrations). A vertical dashed line indicates the mean of MI values for both parts of the distribution (0.19 and 0.324)

MI distribution calculated from the bootstrapped samples (a: for the accepted registrations; b: for the rejected registrations). A vertical dashed line indicates the mean of MI values for both parts of the distribution (0.19 and 0.324)