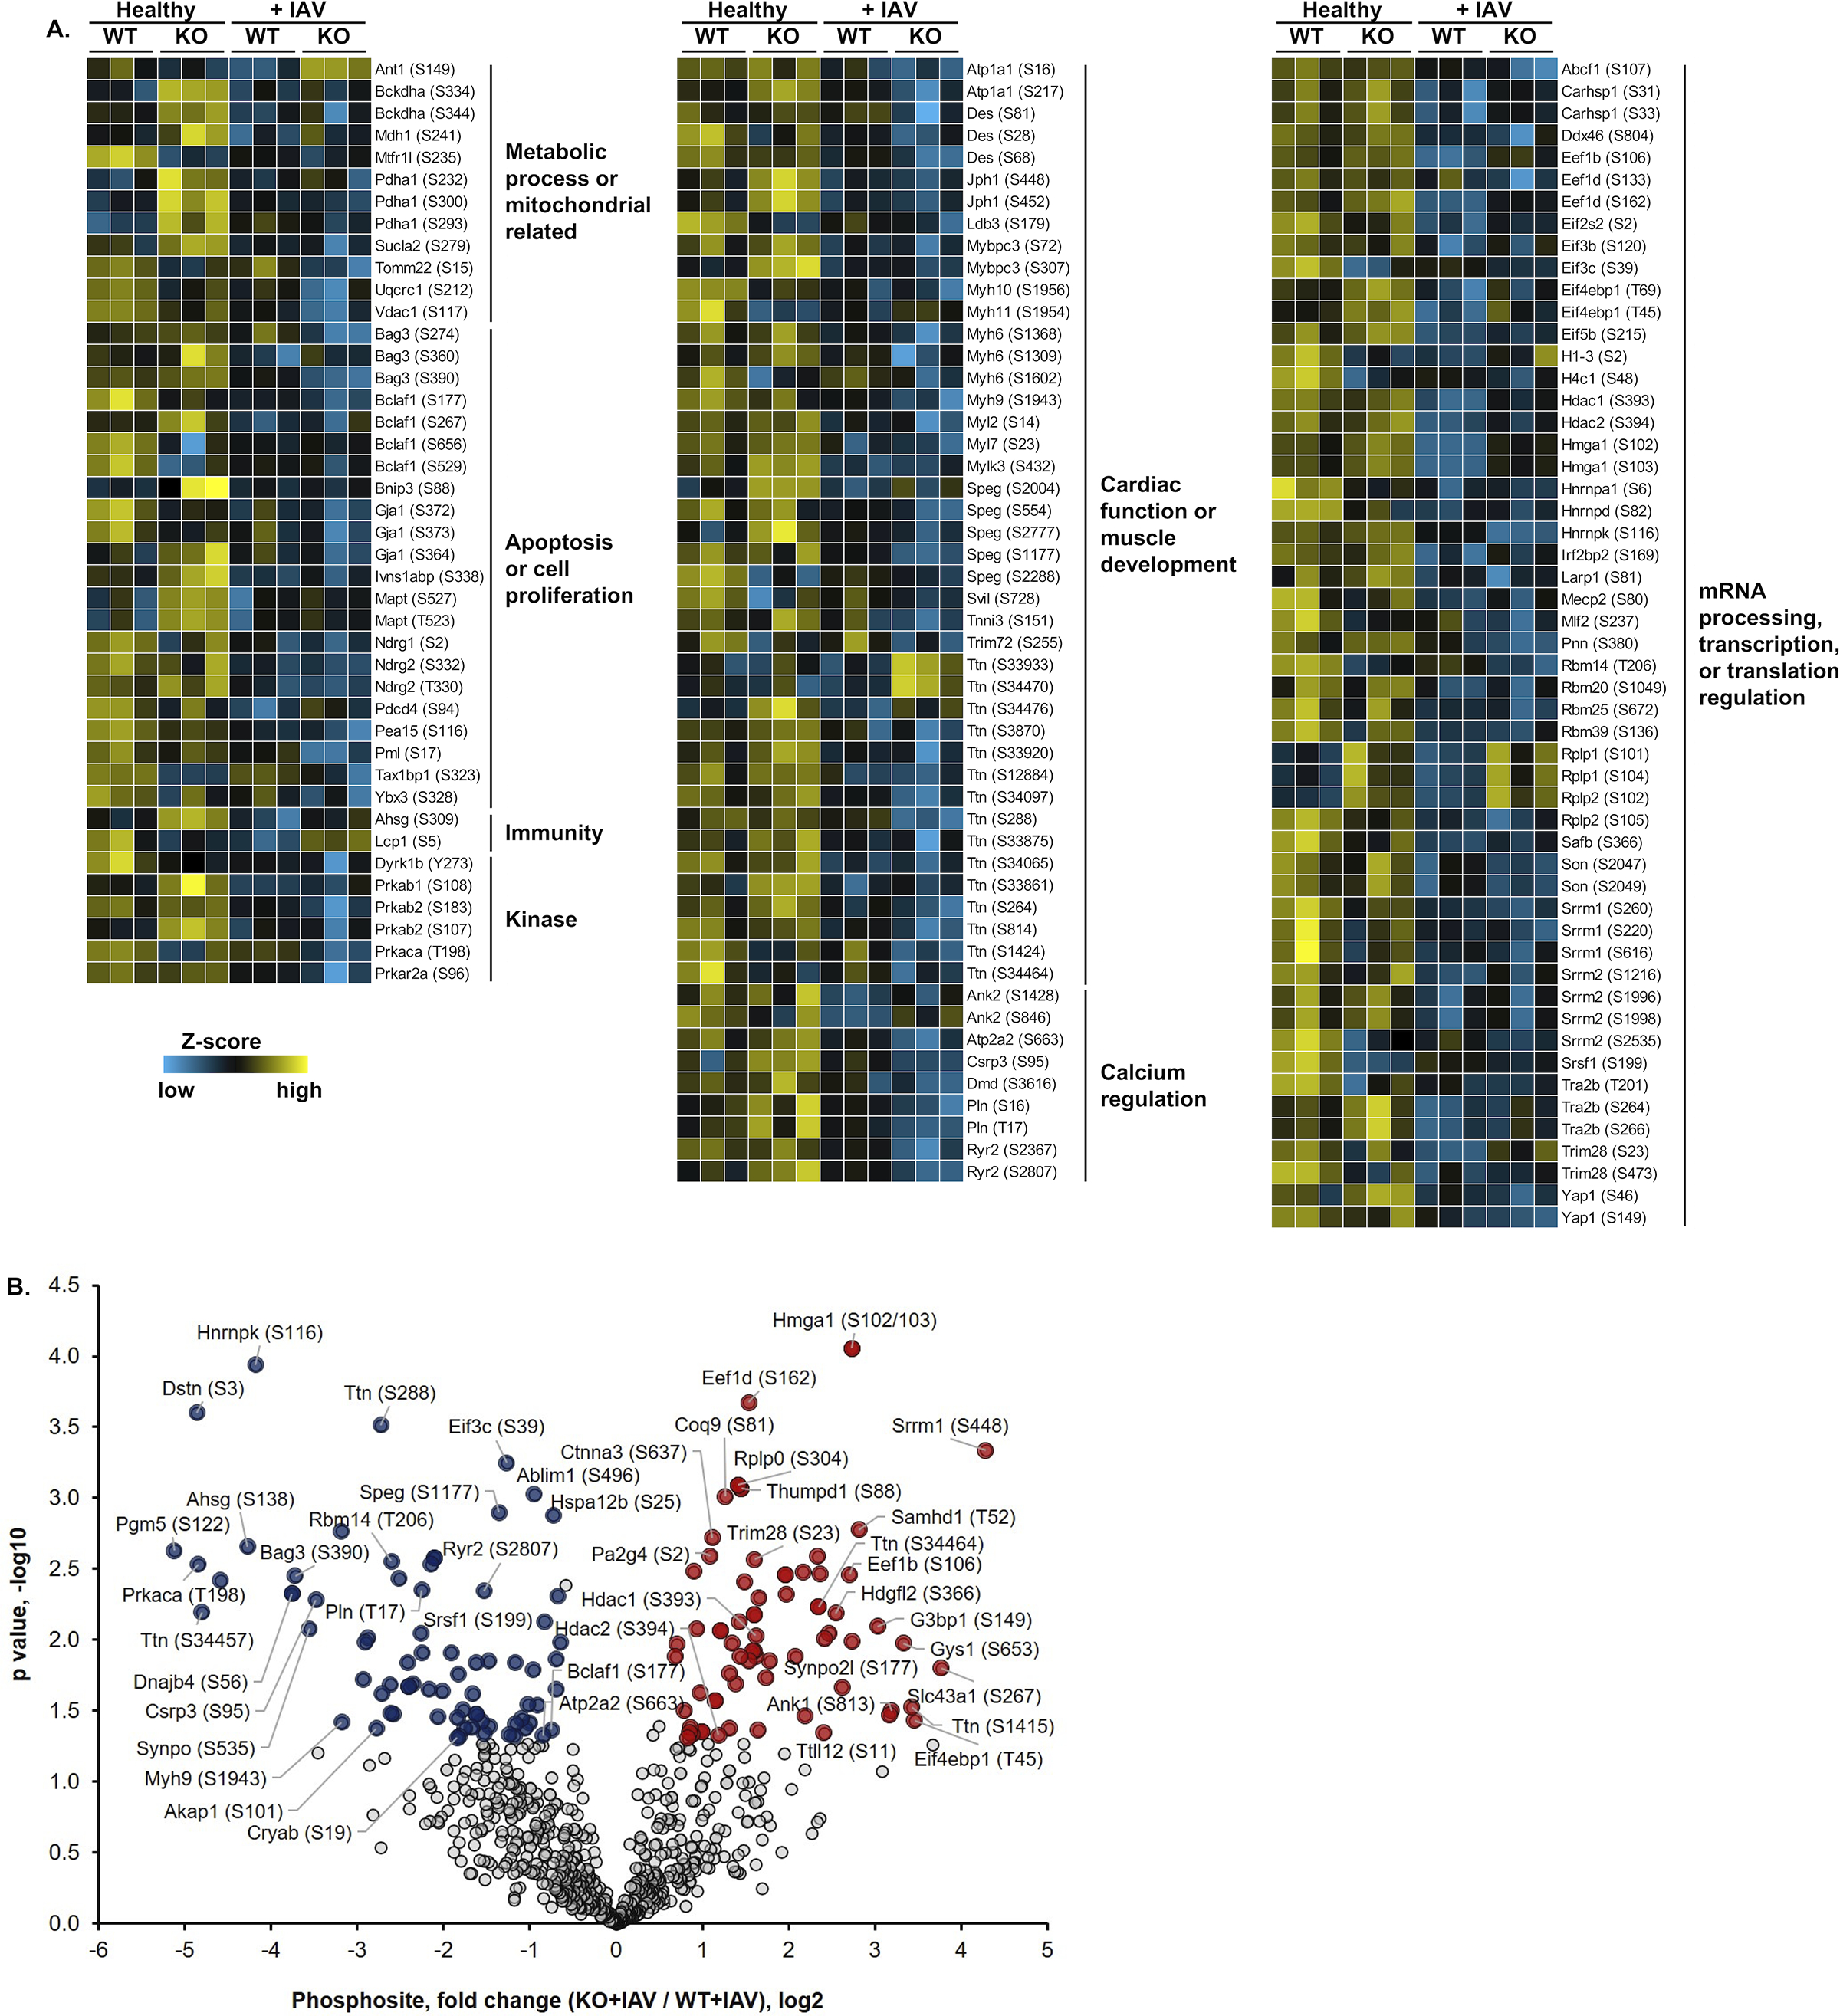
Figure 6: Influenza virus infection leads to changes in phosphorylation of cardiac proteins.

(A) Quantitative phosphoproteomic profiling of mouse heart. Plotted here are selected proteins and their identified phosphosites (indicated in the parentheses) grouped by protein functions or related pathways. (B) Quantitative comparison of IAV infected or mock infected (PBS challenge) WT and MLKL KO mice (n = 3 per group). Fold change of the phosphosites (x-axis) and their significance (p value, y-axis) were plotted. Up- and down-regulated proteins (1.5-fold cutoff) are highlighted in red and blue, respectively. Phosphoproteomic data is representative from 2 separate experiments done with 3 mice of each sex, no sex based differences were observed.
