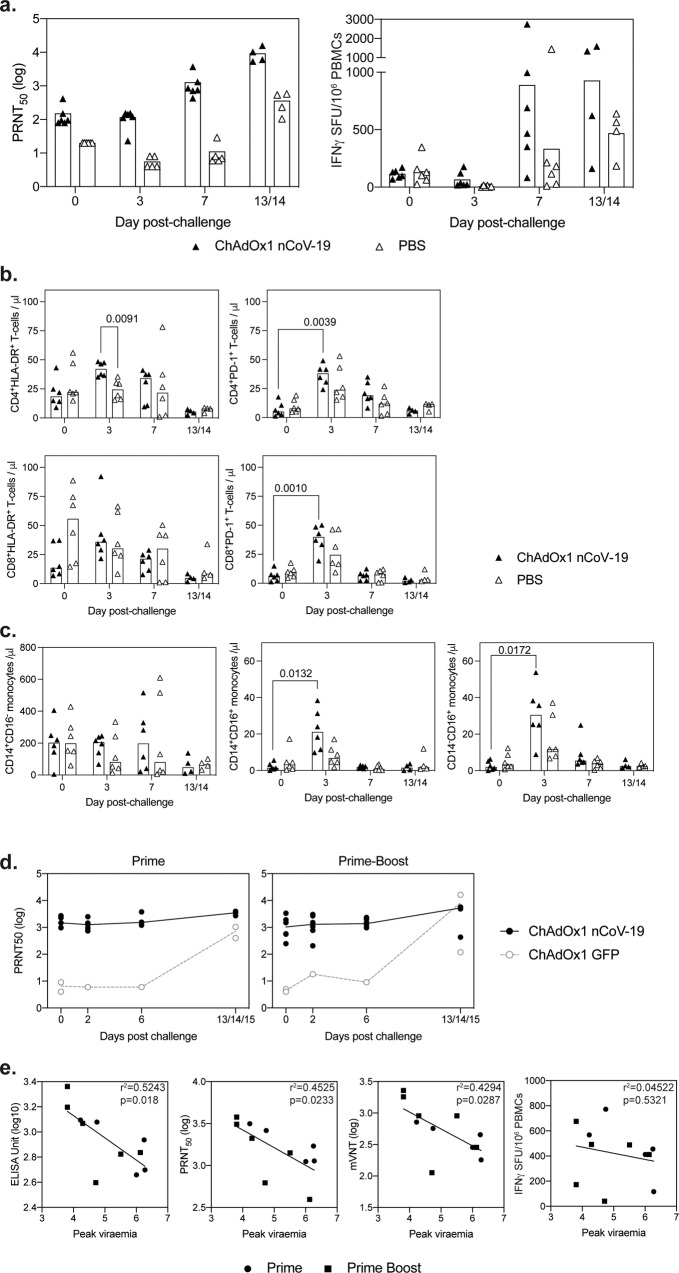
Fig. 5. Immune responses following challenge with SARS-CoV-2.
a Immune responses following challenge of rhesus macaques with SARS-CoV-2 were measured in virus neutralisation assays and by IFNγ ELISpot. b Quantification of CD4+ and CD8+ T cells expressing HLA-DR and PD-1 prior to (day 0) and at days 3, 6−7 (7) and 13−14 post SARS-CoV-2 challenge of NHPs. Data in each graph was analysed with a two-way analysis of variance (repeated measure) and a post hoc Tukey test, p values indicate a significant difference (p < 0.05) within vaccine groups over time. c Quantification of NHP monocyte subpopulations determined by the expression of CD14 and CD16 by whole blood immunophenotyping flow cytometry assay. Bars show group medians with values measured in individual animals shown. Data in each graph was analysed with a two-way analysis of variance (repeated measure) and a post hoc Tukey test, p values indicate a significant difference (p < 0.05) within vaccine groups over time. d Antibody responses in ferrets following challenge were measured in the virus neutralisation assay. e To determine whether antibody responses impacted on the protection of ferrets from SARS-CoV-2 infection, a Pearson correlation analysis was performed comparing peak viraemia in each ferret to IgG ELISA Unit, neutralisation titre (PRNT50), psuedoneutralisation titre (mVNT), or IFNγ ELISpot on the day of challenge, r2 and p values are indicated on each graph.

