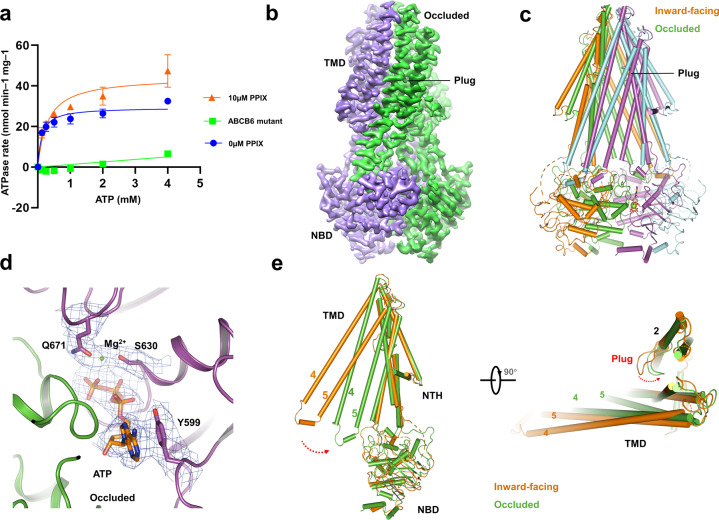
Fig. 3. Occluded conformation of hABCB6.
a ATPase activity of WT hABCB6 in lipid nanodiscs with different concentrations of PPIX: 0 μM (blue circles, blue curve) and 10 μM (red triangles and red curve). ATPase activity of hABCB6[EQ] in a nanodisc is shown as green squares and green curve. Data points indicate means of three independent measurements and error bars indicate SD. b Surface representation of occluded conformation. c Stick model comparison between the occluded and inward-facing structures. d Nucleotide-binding site and electron microscopy density of hABCB6, ATP, Mg2+, and residues around ATP are labeled. e Stick model comparison between the occluded and inward-facing monomer conformation. The swap direction of TM4, 5, and “plug” is labeled by a red arrow.

