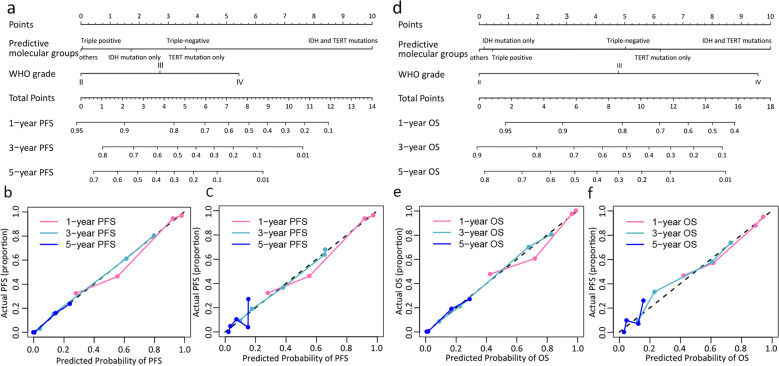
Fig. 2. The nomograms and calibration curves.
(a) Combined nomogram incorporating the predictive molecular groups and WHO grade for predicting PFS; (b-c) Calibration curves of the nomogram (a) in the training and validation datasets, respectively; (d) Combined nomogram incorporating the predictive molecular groups and WHO grade for predicting OS; (e-f) Calibration curves of the nomogram (d) in the training and validation datasets, respectively.

