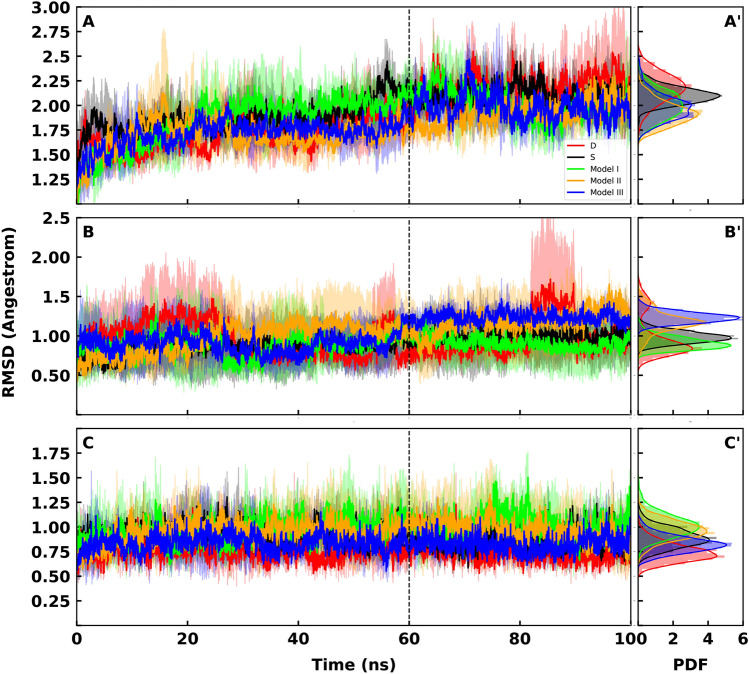
Figure 7.
(A) Average backbone RMSD plots for ACE2 calculated from all replicates of each system and are shown for model S (black), model I (lime), model II (orange) and model III (blue). Light shades around each plot presents standard error for each calculation. RMSD of model D is shown in red. (A’) Probability Density Function (PDF) of RMSD sampled over the last 40 ns (dashed line) of the simulations are shown in histograms. (B) Average backbone RMSD plots for -Helix1 calculated from all replicates of each system and are shown for model S (black), model I (lime), model II (orange) and model III (blue). Light shades around each plot presents standard error for each calculation. RMSD of model D is shown in red. (B’) Probability Density Function (PDF) of RMSD sampled over the last 40ns (dashed line) of the simulations are shown in histograms. (C) Average backbone RMSD plots for -Helix2 calculated from all replicates of each system and are shown for model S (black), model I (lime), model II (orange) and model III (blue). Light shades around each plot presents standard error for each calculation. RMSD of model D is shown in red. (C’) Probability Density Function (PDF) of RMSD sampled over the last 40 ns (dashed line) of the simulations are shown in histograms.

