Figure 9.
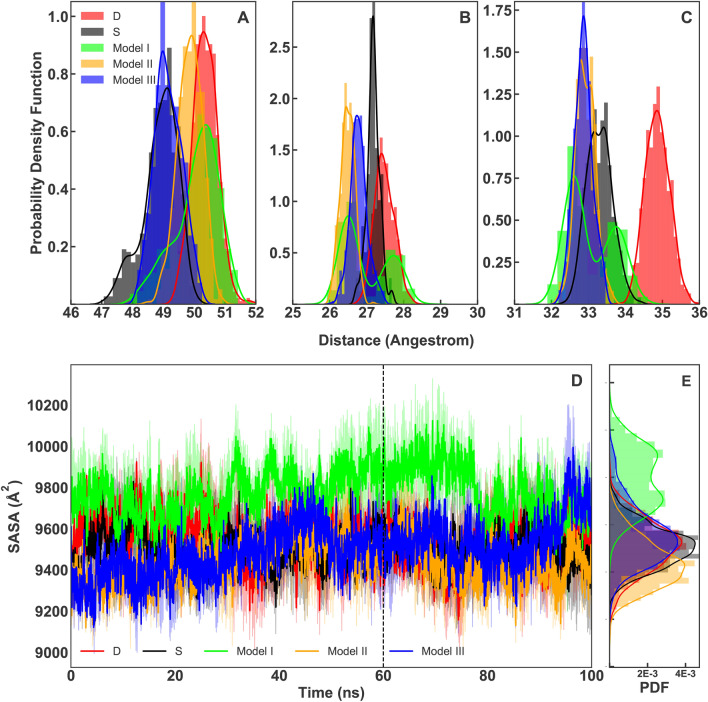
(A) PDF of RBD to ACE2 averaged distance distribution with a histogram and maximum likelihood gaussian distribution fit: calculated from all replicate of each system and are represented in black, lime, orange and blue for models S and I–III respectively. PDF of model D is shown in red. (B) PDF of RBD to H1 averaged distance distribution with a histogram and maximum likelihood gaussian distribution fit: calculated from all simulations of each system and represented in black, lime, orange and blue for models S and I–III respectively. PDF of model D is shown in red. (C) PDF of RBD to H2 averaged distance distribution with a histogram and maximum likelihood gaussian distribution fit: calculated from all simulations of each system and represented in black, lime, orange and blue for models S and I–III respectively. PDF of model D is shown in red. Sampling were done from the last 40 ns of simulations. (D) SASA plots of RBD-ACE2 interface that calculated from all simulations of each system and represented in black, lime, orange and blue for models S and I–III respectively. The SASA plot of model D is shown in red.

